Kano Model for Product Roadmaps: Must-Have, Performance & Delighter Features
Using Kano Maps to Build Love, Not Just Loyalty
This is one of RoadmapOne ’s articles on Objective Tagging methodologies .
Note: This article covers using Kano to tag objectives by satisfaction type (Must-Have, Performance, Delighter) for portfolio analysis. For using Kano to prioritise features by sequence (Must-Haves first, then Performance, then Delighters), see Kano Prioritisation .
Beyond Satisfaction Surveys: Using Kano Tagging to Build Love, Not Just Loyalty
The Kano model sorts product features into three categories by how they affect customer satisfaction: Must-Haves (basics whose absence enrages but whose presence barely registers), Performance attributes (where more is linearly better), and Delighters (unexpected features that create outsized joy). Kano tagging applies those labels to your objectives so you can see how your roadmap spend is balanced across the three.
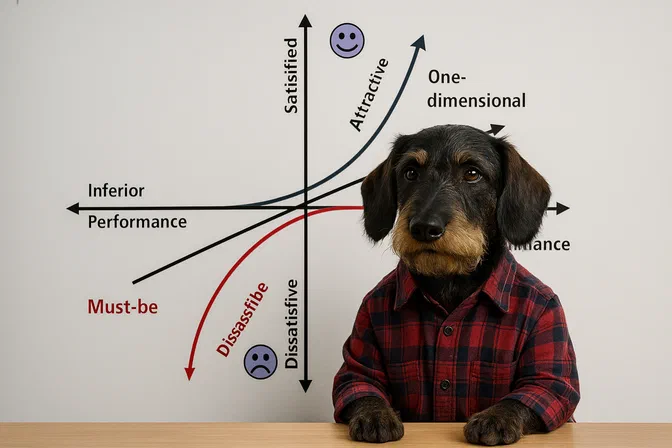
In 1984 Japanese scholar Noriaki Kano rocked quality circles by proving that customer satisfaction is non-linear: fixing irritants stops churn, but delight comes from unexpected magic. The Kano Model formalised this into three categories:
- Must-Have (Basic) Attributes – Absence enrages; presence barely excites.
- Performance Attributes – More is better; linear satisfaction curve.
- Delighters (Exciters) – Surprise features that delight even in small doses.
Note that this is the traditional view of the Kano map. Personally my preference is to show the Must-Haves dropping off much more precipitously but I’ve included the traditional form here for ease.
Two additional categories—Indifferent and Reverse—exist but rarely consume roadmap resources. Tagging backlog items accordingly helps PMs avoid the common trap of chasing Delighters while Must-Haves rot, or shipping only basics until competitors steal hearts with delight.
I’m a big fan of a Kano map - it’s very rare that I don’t draw one at some point when talking to a CTO or CPO. Again, it’s more of a thinking tool, but the really important point is that if you don’t have the Must-Have’s, then the delighters are completely irrelevant! You can’t achieve Product/Market fit, or an MVP (remember V is for Viable) without hitting the must-haves).
The other thing that’s crucial to remember is that the competitive landscape isn’t static. When all your competitors have shiny feature X, it’s no longer a delighter, it’s table stakes. When your sales team are suddenly losing to a competitor because of shiny feature X, it’s no longer a delighter, it’s table stakes. See the case study below.
On the other side, your innovation curve can drive what customers expect from a product in your market segment. Pushing some super-cool delighters can change your win rate and suddenly competitors are scrambling to keep up. Your delighters are suddenly industry must-haves.
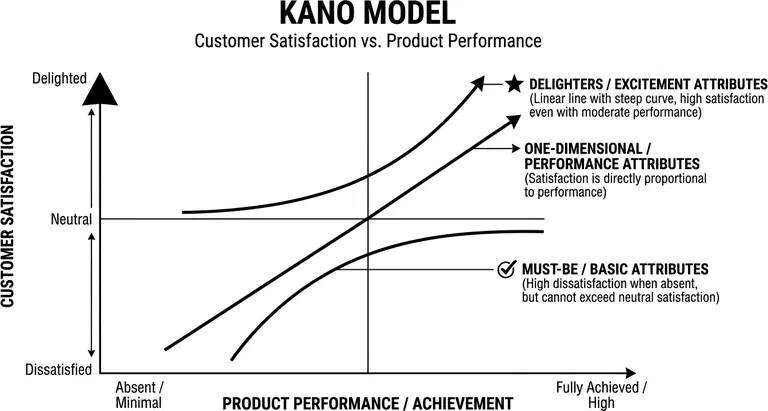
Visualising the Curves
A traditional Kano graph plots feature investment (x) vs customer delight (y). Must-Haves stay low only until absent; Performance slopes linearly; Delighters spike early then plateau. Over time, delightful innovation becomes a basic need - this is both a benefit and a curse. Must-haves create moats that competitors need to address, but the amount of complexity in our own solution necessarily increases over time as we need to sustain all the features. See also the innovation ambition matrix for the Innovator’s Dilemma.
In the AI era this drift has accelerated sharply. When the cost of building a feature has collapsed to near zero, your competitors can copy your delighters in weeks, not years. The dashboards that took my French team six months to mature would today be a weekend’s work for a team with a decent LLM in the loop. That means delighters commoditise into must-haves faster than ever—the half-life of “wow” is shrinking. What hasn’t changed is the cost of convincing a customer to buy, so the strategic value of a delighter is less in the feature itself and more in the window of differentiation it buys you before the market re-tags it. Your Kano map needs revisiting far more often than the annual cadence most teams assume.
Tagging Workflow
- Customer Research First – Use surveys (“functional + dysfunctional” questions) and interviews to categorise features.
- Create Exclusive Tag Group – Must-Have, Performance, Delighter.
- Set SLO Guard-Rails – Must-Have items tied to reliability KPIs; failure escalates capacity automatically.
- Delighter Budget – Cap Delighter spend unless NPS ≥ 40 and Must-Have SLOs are green. Make this visible through capacity-based planning .
Practical Examples
| Feature | Kano Tag | Rationale |
|---|---|---|
| Two-factor authentication | Must-Have | Absence triggers churn in enterprise buyers |
| Dashboard load time | Performance | Faster directly lifts CSAT curves |
| Confetti animation on goal completion | Delighter | Surprise joy; low incident risk |
Case Study: CPA Global
When I joined CPA Global in 2012, our loss rate for new logos on one of our products was shocking: we were pretty much losing every deal and our wonderful new platform that would supposedly change the game was still 2-years away.
The sales team were telling anybody that would listen that our competitors had dashboarding capabilities that we lacked. The pretty charts on the homepage were a game-changer for demos. What had previously been considered a delighter was suddenly a must-have for the industry. Where we didn’t have the feature, our platform was seen as horribly legacy.
The old-school product marketing team were off working with a third-party, creating an awful Franken-customer experience that bolted analytics and dashboards on the side. Continuing the theme of treating dashboards as a delighter, this was proposed as a very significant cost-plus option.
To quickly stem the bleeding, our super-cool French development team knocked up version 1 of dashboards: nothing more than a few pre-canned reports on the homepage. These couldn’t be edited, always showed in the same place, and had almost no customisability—but our customers were over-the-moon with excitement. Our loss rate dropped instantly, and by the time we’d spent six months iterating on the dashboards, customers were telling us we were the innovators.
The lesson is the one that matters most about Kano: the categories are not fixed. Dashboarding had drifted from delighter to must-have while we weren’t looking, and the moment our sales team started losing deals over it, the market had already re-tagged the feature for us. We just hadn’t updated our own map. This is why a Kano tag is a living thing, not a label you assign once and forget.
In my advisory work, I constantly run into B2B software where the customer’s homepage is a workhorse—functional but ugly. I’ve seen so much win from companies “zhuzhing up” the landing page with a few charts. It’s the first thing a potential customer sees… MAKE IT BEAUTIFUL.
Avoiding Anti-Patterns
- Delighter Frenzy – PMs over-index on shiny demos. Cure: No Delighters when any Must-Have SLA is red.
- Neglected Performance Ramps – Speed, accuracy, or choice range rarely go viral yet drive paying upgrades. Tag them visibly.
- Static Tags – Attributes drift; a Delighter often becomes a Must-Have (mobile check deposit, dark mode). Schedule annual recategorisation.
Integrating with Pricing Strategy
- Must-Haves dictate entry-level SKU competitiveness.
- Performance features ladder into tiered pricing.
- Delighters support premium or loyalty campaigns. Tagging clarifies which features justify upsell slides.
Board Conversations
“We’ve ring-fenced 25 % of next sprint to eliminate Must-Have SLA breaches—cheap insurance against churn. Only after that do we spend 10 % on Delighter animations tied to referral targets.”
The hierarchy is logical, visually enforced by tag allocations.
Frequently Asked Questions
What are the three levels of quality in the Kano model?
The three categories that drive most roadmap decisions are Must-Haves (basic attributes whose absence enrages customers but whose presence barely registers), Performance attributes (one-dimensional features where more is linearly better), and Delighters (excitement attributes that create disproportionate joy when present but cause no dissatisfaction when absent). Two further categories—Indifferent and Reverse—exist but rarely consume roadmap budget.
What is an example of the Kano model in practice?
When I joined CPA Global, dashboards had drifted from delighter to must-have. Competitors had pretty charts; our sales team started losing deals without them. A few pre-canned reports on the homepage—no customisation at all—instantly stemmed our losses, and after six months of iteration customers were calling us the innovators. The same feature occupied all three Kano categories within two years.
What is the difference between Kano tagging and Kano prioritisation?
Tagging applies Kano labels to objectives so you can analyse portfolio balance—“are we spending 80% of capacity on delighters while must-have SLAs are red?”. Prioritisation turns those labels into a build sequence—must-haves first, then performance, then delighters. Tagging is retrospective diagnosis; prioritisation is a prospective decision. See Kano prioritisation for the sequencing side.
How often should you re-tag features using the Kano model?
More often than the annual cadence most teams assume. Delighters commoditise into must-haves as competitors copy them, and in the AI era—where building a feature costs almost nothing—that drift has accelerated. Re-tag whenever your sales team starts losing deals over a feature you’d classed as a nice-to-have; that’s the market telling you it has already re-categorised it as table stakes.
Key Takeaways
- Kano tagging prevents delight theatre by ensuring basics and performance ramps stay funded.
- As features commoditise, tags must evolve—RoadmapOne’s recategorisation history shows how expectations shift.
- Balanced Kano portfolios beat rivals twice: fewer defections, more love.
For more on Objective Tagging methodologies, see our comprehensive guide .
