RoadmapOne Blog (143 articles)
Practical guidance on OKRs, roadmap planning, life as a CTO/CPO, and aligning engineering effort with business outcomes.

RoadmapOne 4.0: WIP Limits, JIRA Integration, and SAFe Support
The biggest release yet — plan smarter, integrate deeper, and ship with confidence
RoadmapOne 4.0 is here — WIP Limits, JIRA Integration, SAFe support, collapsible teams, and a host of improvements to help you plan smarter.

RoadmapOne's JIRA Integration
Bridge the Gap Between Strategy and Execution
RoadmapOne is the Strategic layer, JIRA is the execution layer. Let's recognise the difference, use the right tool for the job, but ensure that the two tools sing in perfect harmony
Objective Prioritisation, The Science of Sequencing Strategy
Objective prioritisation is the brutal art of choosing which objectives to fund first. Learn how RICE, ICE, WSJF, MoSCoW, NPV, ARR, Kano, Cost of Delay, Payback Period, Buy a Feature, ROI, Benefit, and more turn infinite backlogs into executable roadmaps.

Objective Tagging, The Missing Connectivity between your backlog and The Board
A unifying guide on how roadmap tagging turns strategy into daily decisions, accelerates board alignment, and becomes effortless with RoadmapOne.

Key Result Tagging, The Science of Measuring What Matters
Transform how you measure success—Key Result tagging reveals whether you're measuring the right things, with the right confidence, using the right methods.

Product Discovery in Roadmaps: Why Your Invisible Discovery Work Keeps Getting Cut
Make Discovery Visible, Measurable, and Defensible
Discovery work is invisible in most roadmaps—which is why it gets cut first and costs you most. Here's how to make discovery visible, measurable, and defensible when stakeholders ask why you're not shipping faster.

SaaS Financial Metrics: The Numbers That Determine Your Destiny
SaaS financial metrics like Rule of 40, Magic Number, LTV:CAC Ratio, and CAC Payback Period determine whether your business is healthy. Learn how these metrics connect to your roadmap—and why your roadmap is the lever that moves them.

Strategy for Product Leaders: Eight Frameworks for the AI Era
What Each Framework Actually Forces, How They Combine, and Why All Eight Point at the Same Operational Question
The eight strategy frameworks every product leader should know in 2026—Playing to Win, 7 Powers, Good Strategy Bad Strategy, Wardley Maps, Blue Ocean, Porter's Five Forces, Porter's Generic Strategies, and SWOT. Each is a thinking scaffold that forces a specific conversation. Together they are the toolkit for strategy that survives AI-era disruption and actually connects to the roadmap.

What Is a Zombie Project? How to Spot and Kill the Work That Won't Die
The hobby projects, sunk-cost drift, and limping cash cows quietly eating your capacity
A zombie project consumes people, budget and attention while having no realistic path to value — and nobody kills it. Here's how to spot one (you can't draw a line to an outcome), the three species on the undead continuum, and why the kill almost always has to come from the board.

What Is the HiPPO Effect? When to Trust It and When to Suppress It
The Highest Paid Person's Opinion is a bias to fear — and a responsibility you were hired to carry
The HiPPO effect — the Highest Paid Person's Opinion overriding the evidence — is real and dangerous. But the opposite failure, a leader who defers every decision to 'the team' and never pushes the organisation forward, is just as costly. Here's how to tell signal from ego.

What Is a Watermelon Project? How to Spot One Before the Write-Off
Green on the outside, red on the inside — and how to read a status report that's lying to you
A watermelon project is reported green on the surface while the reality underneath is red. Here's why watermelon reporting happens, how to spot a fake green before the write-off, and the board-room detection playbook I use in PE diligence and NED work.

Does Your Capacity Actually Match Your Growth Plan?
The board signs off a 40% growth plan. Engineering capacity, honestly audited, shows 8% of squad-sprints allocated to growth work. Both numbers cannot be true. The arithmetic that reconciles them is what every business plan relies on and almost no product organisation actually does — and it's the single most productive thing a CPO, CTO or NED can put on the table.

Punctuated Equilibrium: Why a Two-Week Sprint Is Two Weeks
Every agile team does two-week sprints, and almost nobody can tell you why two weeks. The answer is borrowed from evolutionary biology. Eldredge and Gould's theory of punctuated equilibrium explains why a two-week rhythm is the engineered punctuation of organisational stasis — and why a one-week cadence exhausts teams while a four-week cadence lets decay set in.

Sometimes People Have to Grab Hold of the Electric Fence
Sometimes people have to grab hold of the electric fence. Sometimes you have to pull them back from it. The craft of leadership is knowing which is which — and a Type A vs Type B decision framework that helps you get it right more often than wrong.

Users Do Not Experience Averages
No user ever experiences an average. Every user experiences a single point on a distribution — and dashboards that report means are lying to boards about the real user experience. A primer for analysts, PMs and CPOs on standard deviations, common-cause vs special-cause variation, wing-to-wing outcomes, and how to actually present data to a board.

Work On the Org, Not In the Org
Every CTO I have watched get ejected from a senior role had the same root cause — they worked in the org rather than on it. Your job is not to pull the train. Your job is to build an engine that can pull the train. A practical guide to the 1:1 cadence, the hiring standard, and the cultural discipline that produces CTOs and CPOs who last.

Product Portfolio Roadmaps: Why Your Roadmap Is a Portfolio Allocation Decision, Not a Feature List
Very few companies have one product. Most are portfolios — multiple products at different lifecycle stages, each needing a different operating model, a different team shape, and a different share of the roadmap. The roadmap IS the portfolio allocation decision. Here's how to see your portfolio clearly, diagnose the common failure modes (including the 'CEO-interest-led' anti-pattern), and allocate capacity per product using the frameworks that actually work.

7 Powers: Hamilton Helmer's Durable Moats and the AI Reframe
Which Powers Strengthen, Which Erode, and How to Tag Your Roadmap Against Them
Hamilton Helmer's 7 Powers is the rigorous definition of what actually makes a moat durable. In 2026, AI rewrites which Powers strengthen and which erode — and product leaders need a sharper view of which Power each squad is building.

Blue Ocean Strategy: Value Innovation Reframed for the AI Era
Red Oceans Get Redder Faster—and the Strategy Canvas Quietly Encourages Exactly the Wrong Move
Blue Ocean Strategy's value innovation canvas taught a generation of strategists to find uncontested market space through feature differentiation. In 2026, features are cloned in weeks and red oceans get redder faster. The surviving blue oceans are about channel, segment, and workflow — not features.

Good Strategy Bad Strategy: Rumelt's Kernel as a Fluff Detector
Diagnosis, Guiding Policy, Coherent Action—and How to Tell Product Strategy From Word Salad
Richard Rumelt's Good Strategy Bad Strategy offers a three-part kernel—diagnosis, guiding policy, coherent action—and a practical test for separating strategy from fluff. Apply it to your product roadmap before writing the business case.

Playing to Win: The Strategy Cascade as a Forcing Function
Why Roger Martin's Five-Question Framework Is a Thinking Scaffold, Not a Fill-in Template
Roger Martin's Playing to Win is a thinking scaffold, not a template. Use the five-question strategy cascade to force honest strategic answers—and to structure the business case no product should go on the roadmap without.

Porter's Five Forces: What the AI Era Has Rewritten
Threat of New Entrants Is Now Effectively Infinite—and Three Forces Need Updating
Porter's Five Forces remains the right scaffold for diagnosing industry structure, but three of the five forces have structurally changed in the AI era. Threat of new entrants is effectively infinite, substitutes appear faster, and rivalry intensifies on one side. Two forces still work fine.

Porter's Generic Strategies: Why Focus Is the Only Survivor in the AI Era
Cost Leadership Is Dead; Feature-Based Differentiation Is Dead; Segment-Plus-Channel-Plus-Brand Focus Is the Surviving Winning Position
Porter gave us three generic strategies: cost leadership, differentiation, focus. In 2026, AI has killed cost leadership as a durable moat in software, feature-based differentiation is cloned in weeks, and focus (segment specialisation combined with channel and brand) is the only surviving strategy. This changes everything about capacity allocation.

SWOT Analysis: Why a SWOT Is Not a Strategy (and How to Use It Anyway)
The 1997 Paper That Called for Its Recall, the 40-Factor Trap, and How to Turn a SWOT Into an Input for Real Strategic Choice
SWOT analysis has been the default situational-assessment tool for forty years, and in 1997 academics called for its recall. Twenty-nine years on, most organisations still produce the 40-factor, un-prioritised, never-actioned SWOTs the critics warned about. A SWOT isn't a strategy. Here's how to use it anyway.

Wardley Maps: Situational Awareness for Product Leaders in the AI Era
Mapping Your Value Chain, Tagging Components by Evolution, and Connecting Pioneers-Settlers-Town Planners to Squad Allocation
Wardley Maps are the map strategy has been missing. Plot your value chain against the evolution axis—genesis, custom, product, commodity—and you see which components your squads should pioneer, settle, or industrialise. In 2026, AI accelerates every component's march toward commodity, and the map has to be redrawn more often.

Zone to Win: Geoffrey Moore's Portfolio Framework for Balancing Your Product Investment
Geoffrey Moore's Zone to Win sorts every pound of product and engineering spend into four zones — Performance, Productivity, Incubation, and Transformation. The framework's real value isn't prescribing the right mix. It's forcing honest visibility of your current mix, so the board can see whether zero Transformation spend (a slow-motion disruption waiting) or three simultaneous Transformations (theatre) is quietly hollowing out the core.

Business Case for a New Product: The 3-Page PID Template That Forces ExCo Alignment
A business case for a new product is not a forecast — it's the alignment artefact that forces every ExCo member to commit, in writing, to their functional contribution to the product's success. This article covers the tight 3-page Project Initiation Document (PID) template that took Trayport to 62% CAGR, why PE-owned companies are better at this than anyone else, and why nothing should be allowed onto the roadmap until the PID is signed.

AI Made Building Your Product Free. Crossing the Chasm Is Still Exactly Where It Always Was.
AI has collapsed the cost of building your product to near zero. The chasm between early adopters and the early majority is exactly where it always was — and it's wider than ever. Here's what that means for your roadmap, your team allocation, and the grown-up conversation your board needs to have.

Assumption Mapping: David Bland's 2×2 for Deciding What to Test First
Assumption mapping is the workshop discipline that tells a product team which assumption to test first. David Bland and Alex Osterwalder's 2×2 — importance × evidence — surfaces the 'leap of faith' assumptions that belong at the top of the discovery queue. In 2026, when building is nearly free, assumption mapping is the single highest-leverage hour a product team spends each quarter.

Diffusion of Innovations: Rogers' 5 Adopter Categories and the Technology Adoption Lifecycle
Everett Rogers' Diffusion of Innovations — the technology adoption lifecycle — describes the five adopter categories (innovators, early adopters, early majority, late majority, laggards) through which every new product passes. Here's what Rogers' framework actually means for your roadmap, your GTM motion, and why AI has made some adopter categories much harder to reach — and others much easier.

Early-Stage Product Validation: Seven Thinking Tools for 'Should This Idea Even Ship?'
Seven thinking tools for the stage before product-market fit — the stage where the honest answer to 'should this idea ship at all?' is usually no, or not yet, or not in this form. Problem-solution fit, riskiest assumption tests, assumption mapping, the Mom Test, MVP vs MLP vs MVA, Proof of Usefulness, and PMF measurement itself. Each framework answers a different question; sometimes the answer is 'stop validating and ship', sometimes it's 'stop building and listen'. This directory is for product leaders deciding which lens to pick up.

Gartner Hype Cycle: The 5 Phases and How to Use It for Roadmap Timing
The Gartner Hype Cycle plots emerging technologies through five phases — Innovation Trigger, Peak of Inflated Expectations, Trough of Disillusionment, Slope of Enlightenment, Plateau of Productivity. Here's how to use it as a roadmap tool rather than as conference wallpaper — when to bet on an emerging technology, when to wait, and why PE portfolio companies consistently get the timing wrong.

MVP vs MLP vs MVA: Minimum Viable, Lovable, or Awesome?
MVP, MLP, or MVA? Frank Robinson's Minimum Viable Product was designed to learn, not ship. Brian de Haaff's Minimum Lovable Product added an emotional bar. Minimum Viable Awesome (or Minimum Awesome Product) argues that in 2026 'minimum' is the wrong target entirely. When building is nearly free, the only defensible goal is magnificent in at least one dimension — your crown jewel.

Platform Business Models: Why Network Effects Are the Only Moat AI Cannot Erode
Platform business models — marketplaces, multi-sided platforms, ecosystems — don't sell products. They orchestrate exchanges between participants and capture a share of the value. In the AI era, where build cost has collapsed, network effects are the one remaining moat that AI cannot erode. Here's what that means for your roadmap, your PE valuation, and why platform plays dominate the next decade.

Problem-Solution Fit: The Stage Before PMF (And Why It Matters More Now)
Problem-solution fit is the stage before product-market fit — the one where you prove the problem is worth solving before you spend a penny on building a solution. In the AI era, when building is nearly free, problem-solution fit is the only discipline that stops teams from shipping ten wrong products in the time it used to take to ship one.

Product Life Cycle Stages: What Your Roadmap Should Look Like at Each Stage
The product life cycle has four stages — introduction, growth, maturity, decline — and every marketing textbook will tell you what they are. Almost none tell you what you actually need to know: how your roadmap, team shape, and resource allocation must change at each stage. Here's the operating-model view of the product life cycle.

Product Lifecycle Models: Nine Thinking Tools for Smarter Product Roadmap Decisions
Product lifecycle models are thinking tools. Each one helps you reason about where a specific product currently lives and what it genuinely needs next — which may not be more engineering investment at all, but a different go-to-market motion. This directory covers nine lifecycle frameworks, each designed to prompt a different diagnostic question.

Product-Market Fit: How to Measure It Honestly (Ellis, Vohra, Rachleff)
Product-market fit is the only milestone that matters for an early-stage product. AI has collapsed the cost of building, so measuring PMF — using Sean Ellis's 40% test, the Rahul Vohra Superhuman engine, and retention cohorts — now matters more, not less. Here's how to measure it honestly, diagnose fake PMF from a board seat, and allocate a minimum viable team to hunt it down.

Proof of Usefulness: A Weighted Scorecard for Early-Stage Ideas
Proof of Usefulness is a weighted scorecard from HackerNoon (April 2026) that rates early-stage products on real-world utility, traction, reach, technical stability, timing, and completeness. It's not a canonical framework yet — but the weight distribution is a genuinely useful lens for boards and founders asking whether an early-stage bet is real or theatre. Here's how to borrow what works without swallowing it whole.

Riskiest Assumption Test (RAT): Testing What Could Kill Your Product First
A Riskiest Assumption Test (RAT) is the smallest possible experiment that can prove or kill the assumption most likely to sink your early-stage product. Rik Higham coined the term in 2016 as a corrective to the abuse of MVP. In 2026, when building is nearly free, the RAT is arguably the only unit of early-stage work worth funding.

S-Curves in Product Strategy: When to Jump to the Next Curve
The S-curve describes how most product and technology performance improves — slow at first, then rapid acceleration, then flattening as limits are approached. Here's how to recognise when your current S-curve is flattening, how to time the jump to the next curve, and why most companies miss the moment entirely.

The Innovator's Dilemma in the AI Era: Why Your Best Customers Will Kill Your Next Product
Clayton Christensen's Innovator's Dilemma explains why successful companies lose to disruptors they should have beaten. AI has made the problem worse, not better — disruptors now have near-zero build cost and only need to solve distribution. Here's what that means for your roadmap and how to protect your own disruptive bets from your own best customers.

The Mom Test: Customer Interviews That Don't Lie to You
Rob Fitzpatrick's The Mom Test (2013) is the canonical playbook for customer interviews that produce signal rather than polite lies. Talk about their life, not your idea. Ask about specific past behaviour, not hypothetical future intent. Extract commitment, not compliments. In 2026, when building is nearly free, Mom Test discipline is the single biggest separator of teams that find real products from teams that don't.

The Grain of a System: Why Some Platforms Absorb Change and Others Fight It
Every software system has a grain — shaped by its data model and early architectural choices — that determines how easily it absorbs change. Learn how to read the grain for technical due diligence, M&A platform assessment, and everyday product development.
OKR Examples for Product Teams: 30+ Objectives and Key Results That Actually Work
Problems to Solve, Not Features to Build
30+ OKR examples for product teams—framed as business problems, not features. Includes bad-to-good rewrites, real-world examples from Google and Intel, examples tagged by Run/Grow/Transform, and how each Objective connects to squad allocation on your roadmap.

OKRs vs KPIs Explained: The Complete Guide for Product Teams
What You Watch vs What You Chase—And Why Most Teams Confuse the Two
KPIs are what you watch. OKRs are what you chase. KPIs tell finance what happened last quarter. OKRs tell product teams what to change next quarter. Here's the complete guide to the difference—with real examples, common mistakes, and how the two work together on your roadmap.

The Product Operating Model: A Practical Guide From Inside Cagan's Trainline Case Study
From Specs-Over-the-Wall to Empowered Teams — And the Tool We Built to Make It Work
The product operating model is how the best tech-powered companies work. I know because I was there — as CTO at Trainline, featured in Marty Cagan's Transformed. Here's what the product model actually looks like in practice, how we aligned 650 people around outcomes, and why I built RoadmapOne to make it repeatable.

SAFe Roadmap Software: Using RoadmapOne for PI Planning
SAFe organisations need roadmap software that supports PI Planning without the overhead. Here's how RoadmapOne maps directly to SAFe cadences while keeping Product accountable for outcomes.

The Culture of Adequacy: Your Customers Don't Want Minimum — They Want Magnificent
How Product Leaders Accidentally Train Teams to Be Mediocre
Many teams have been conditioned into adequacy: shipping the bare minimum of everything and the full potential of nothing. Here's the spectrum from Minimum Product to Maximally Awesome Product, and why your crown jewels deserve obsessive, beautiful, category-killing investment.

Crown Jewels: Why Your Most Important Feature Is Slowly Dying
Every product has two or three capabilities that disproportionately matter to customers. Over time, product teams lose sight of these crown jewels—until a competitor does them slightly better and the loss ratio spikes. Here's how to identify, protect, and relentlessly improve the features that define your product.

Ship It and Move On: The Recipe for a Mediocre Product
Great Features ALWAYS Need a Second Act
Your roadmap shows Feature X shipping in March, then the team immediately moves on. That's the recipe for a mediocre product—an agglomeration of half-baked MVPs where nothing makes customers go 'wow'. Here's why great products need a second act.

Priority Whiplash: Why Your Best Engineers Are Updating Their CVs
Constant reprioritisation destroys engineering morale faster than anything else. If your team never finishes anything because leadership keeps changing direction, here's what's actually going wrong—and how to fix it.

Dual Track Agile: Balancing Discovery and Delivery on Your Roadmap
Dual track agile—running discovery and delivery in parallel—is essential for empowered product teams. But most implementations fail because they ignore the capacity constraint. Here's how to make it actually work.

Feature Factory to Outcome Team: Breaking the Pattern That's Killing Your Product
Is your product team a feature factory—shipping features without measuring impact, celebrating releases instead of results, burning out your engineers? Here's how to recognise the pattern and break free.

Initiative vs Epic vs Story vs Task: A Clear Hierarchy for Your Roadmap
Initiative, epic, story, task—the hierarchy of work items confuses almost every product team. Here's how to think about it clearly and what actually matters for your roadmap.

Now Next Later Roadmaps: The Simple Framework That Oversimplifies Strategy
Now Next Later roadmaps are popular for their simplicity, but they hide critical capacity constraints and let teams avoid hard prioritisation decisions. Here's why I'm skeptical—and what to use instead.

OKR vs Roadmap: They're Not Competing (Here's How They Connect)
OKRs and roadmaps aren't competing approaches—they're complementary tools. Learn how to connect your Objectives and Key Results to your product roadmap for strategic alignment that actually works.

Outcome-Based Roadmaps: A Practical Guide for Product Teams
Outcome-based roadmaps focus on measurable business results rather than feature lists. Learn how to shift from output-driven planning to outcome-focused product strategy that aligns teams, satisfies boards, and actually moves the needle.

Product Roadmap vs Product Backlog: Different Tools, Different Jobs
Product roadmaps and backlogs serve different purposes for different audiences. Conflating them—or using Jira as your roadmap—is a recipe for strategic confusion and tactical chaos.

Quarterly Roadmap Planning: The Cadence That Actually Works
Quarterly roadmap planning hits the sweet spot—short enough to avoid wasting resources on the wrong things, long enough to achieve meaningful outcomes. Here's how to run a quarterly planning cycle that actually works.

Should You Have a Public Roadmap? A SaaS Decision Framework
Should your SaaS company publish a public roadmap? The answer is 'it depends'—but I've seen public roadmaps transform customer relationships when done right. Here's a decision framework, including a story about a customer who literally shouted in my face.

Vision vs Strategy vs Roadmap: Understanding the Product Hierarchy
Vision, strategy, and roadmap form a hierarchy that most teams collapse or skip entirely. Here's how to think about each level clearly—and why missing the strategy layer is the most common failure.

CAC Payback Period: The Cash Flow Metric That Gates Your Growth Speed
CAC Payback Period reveals how long until customer acquisition investments break even. Learn how this cash flow metric determines how fast you can grow—and how your roadmap can accelerate payback from both sides.

LTV:CAC Ratio: The Unit Economics Metric That Determines SaaS Survival
LTV:CAC Ratio reveals whether your customers generate more value than they cost to acquire. Learn how this fundamental unit economics metric determines SaaS sustainability—and how your roadmap can improve it from both sides of the equation.

Rule of 40: The SaaS Health Metric That Investors Actually Care About
The Rule of 40 is the single metric that tells investors whether your SaaS business is healthy. Learn how growth rate plus profit margin reveals whether you're building sustainably—and how your roadmap can move the number.

SaaS Magic Number: The Growth Efficiency Metric That Reveals Your GTM Truth
The SaaS Magic Number measures whether your sales and marketing investments generate proportional revenue returns. Learn how this efficiency metric separates sustainable growth from expensive growth—and how your roadmap can improve it.

Ansoff Matrix: Strategic Tagging for Growth Risk, Not Prioritisation
Visualise Your Risk Profile, Then Use Real Frameworks to Prioritise
The Ansoff Matrix categorises growth strategies by risk profile—Market Penetration, Market Development, Product Development, Diversification. It's a tagging framework for visualising portfolio balance, not a prioritisation framework.

Dot Voting Has No Business Near Your Roadmap
Democratic Theatre Belongs in Retros, Not Prioritisation
Dot Voting is everywhere—design sprints, retros, roadmap workshops. It belongs in facilitation, not prioritisation. Here's why democracy produces roadmaps that reflect politics, not value.

Double Diamond: Process Framework, Not Prioritisation—And It Needs a Time-Box
Diverge-Converge Twice Is Great Advice, But Discovery Still Has to End
The Double Diamond describes how to do discovery—diverge, converge, diverge, converge. It's a process framework, not a prioritisation framework. Without time-boxing, it becomes an excuse for endless exploration.

Elements of Value Pyramid: Interesting Theory, Limited Practice
An Academic Framework That Doesn't Survive Contact with Roadmaps
Bain's Elements of Value pyramid—30 types of value from functional to life-changing—is an interesting academic framework and training aid. It's not useful for actual roadmap prioritisation. Skip it for practical work; reference it for product thinking discussions.

GE-McKinsey Matrix: Board-Level Portfolio Strategy, Not Feature Prioritisation
When Nine Boxes Beat Four—And When They Don't
The GE-McKinsey Matrix helps boards decide which product lines deserve investment. It's portfolio strategy, not feature prioritisation—here's when the 9-box grid earns its complexity over simpler alternatives.

GIST Framework: You Probably Already Have This Under Different Names
Take the Confidence Meter, Skip the Extra Terminology
GIST (Goals, Ideas, Steps, Tasks) offers a layered planning framework from strategy to execution. Learn how it compares to OKRs, when the confidence meter concept is genuinely useful, and why you probably don't need the full framework.

HEART Framework: Tag Your Roadmap for User-Centred Balance
Happiness, Engagement, Adoption, Retention, Task Success—Are You Measuring All Five?
Google's HEART framework—Happiness, Engagement, Adoption, Retention, Task Success—provides user-centred metrics coverage. Use it as a tagging framework to ensure your roadmap is balanced across UX dimensions, not just shipping features.
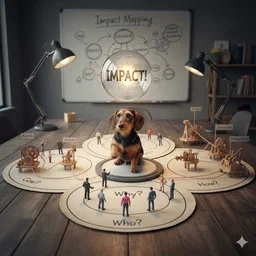
Impact Mapping: Always Think About the User (Because Most Roadmaps Don't)
Goals → Actors → Impacts → Deliverables: The Framework That Stops User-Free Planning
Gojko Adzic's Impact Mapping forces the question most roadmaps ignore: who are we building for, and what behaviour change do we need from them? It's the 'always think about the user' framework that architects desperately need.

Leading vs Lagging Indicators: Know If You're Winning Before It's Too Late
Predict Success with Leading Metrics, Confirm It with Lagging Ones
Leading indicators predict success; lagging indicators confirm it. Good OKRs pair lagging Objectives with leading Key Results—so you know whether you're on track before it's too late to course-correct.

North Star Metric: One Metric to Align Them All
Tag Your Roadmap to See What Percentage Actually Targets Core Value
Your North Star Metric is the single metric that captures core value delivery to customers. Tag Objectives in RoadmapOne to see what percentage of your roadmap directly targets your North Star—and whether the balance is right.

Opportunity Solution Trees: Discovery That Maps to Roadmap Reality
Outcomes → Opportunities → Solutions → Experiments (And How It All Becomes OKRs)
Teresa Torres' Opportunity Solution Tree connects outcomes to opportunities to solutions to experiments. It maps directly to RoadmapOne: Outcomes are Objectives, Opportunities and Solutions become Key Results, and we're always running experiments.

Product Lifecycle Stage: The Tag That Changes Everything About Prioritisation
Why the Same BRICE Score Means Different Things for Different Products
Product Lifecycle Stage—Introduction, Growth, Maturity, Decline—is a tagging framework that changes how you interpret prioritisation scores. A high-BRICE initiative for a declining product might still be the wrong investment.

PULSE Framework: The Outdated Metrics Model Your Dashboard Might Still Follow
If Your Metrics Look Like This, You're Missing the User
PULSE (Page views, Uptime, Latency, Seven-day active users, Earnings) is the outdated metrics framework that HEART replaced. It's still useful as a diagnostic—if your dashboard looks like PULSE, you're missing user-centred measurement.

Stack Ranking: The Prioritisation Panacea That Never Works
Why 'Just Put Them in Order' Ignores Reality
Stack ranking feels like the ultimate prioritisation solution—just order everything from 1 to N and execute. In practice, it ignores capacity, dependencies, and team skills. The item ranked last often must be built before the item ranked first. Roadmaps are art as much as science.

Technical Debt Classification: Internal Insight, Not Board Governance
When Categorising Debt Helps—and When It's Overhead
Technical debt classification helps Product & Engineering teams understand debt composition—but don't expect board engagement on categories. Tag debt-related Key Results by type (deliberate vs accidental, business-blocking vs aesthetic) when debt is a significant problem requiring structured remediation.

The 100 Dollar Test Is an Alignment Tool Disguised as Prioritisation
Use It for Buy-In, Not Backlogs
The 100 Dollar Test forces trade-offs by giving stakeholders fake money to allocate. It's better for alignment than prioritisation—the real value is the conversation it creates, not the numbers it produces.

The Eisenhower Matrix Has No Place in Roadmap Planning
It's Vocabulary, Not Methodology—Here's What to Use Instead
The Eisenhower Matrix isn't a prioritisation framework—it's vocabulary. Learn when the Urgent/Important grid helps board conversations and when it creates dangerous blind spots in your roadmap.

User Story Mapping: Tag Key Results by User Journey Stage
See Which Parts of the Customer Experience You're Actually Measuring
User Story Mapping isn't prioritisation—it's a tagging framework. The backbone represents user journey stages; tagging Key Results by backbone position shows which parts of the customer experience you're measuring. Use it alongside Pirate Metrics for complete journey visibility.

Weighted Scoring Is Subjectivity Wrapped in a Veneer of Objectivity
Why Bespoke Criteria Usually Produce Score-Gaming Theatre
Weighted Scoring promises customised prioritisation through bespoke criteria and adjustable weights. In practice, it usually produces score-gaming theatre. Learn when it works, when it fails, and why simpler frameworks usually win.

Stop Overloading Your Roadmap: Why WIP Limits Are the Most Important Rule in Product Planning
Why the single most important rule for building great product roadmaps is limiting work in progress—and how WIP limits transform both delivery speed and stakeholder conversations.
BRICE Prioritisation: RICE Plus Business Importance
RICE + Strategic Alignment = Roadmaps That Actually Serve Business Goals
BRICE extends RICE with Business Importance—forcing teams to explicitly score strategic alignment before reach and impact. Stop building high-impact features that don't matter to the business.

Pirate Metrics (AARRR): Dave McClure's Growth Funnel for Product Teams
Charting the Customer Voyage from First Click to Profit
Dave McClure's AARRR Pirate Metrics framework (Acquisition, Activation, Retention, Referral, Revenue) reveals where your funnel leaks. Includes an Uber Eats case study, key formulas for each stage, and how to tag your roadmap for board-level visibility.

OKRs for Product Managers & Product Teams: Why Most Fail (How to Fix)
What private equity sees when you tell them you use OKRs — and the CPO playbook to fix it before the value creation plan does it for you
OKRs for product managers done right. 76% of product teams attempt OKRs; only 28% are satisfied. Practical product management OKR examples, objectives, key results, and roadmap connection.

KTLO (Keeping the Lights On): What It Means in Software and Why Your Roadmap Ignores It
Stop pretending that 100% of your P&E team is doing feature development
KTLO (Keeping the Lights On) is the essential maintenance work every engineering team must do—bug fixes, security patches, compliance, and technical debt. Most roadmaps pretend it doesn't exist. Here's how to plan honestly and protect your feature capacity.

RoadmapOne Release 3.2 is here
Introducing PowerPoint Export, and your Finance team's favourite feature
Announcing RoadmapOne Release 3.2. Featuring Powerpoint Export, a simplified user interface, and the one feature your Finance team care the most about

Opex vs Capex: Classifying Roadmap Spend for Finance and Tax Planning
Help your finance team understand capital vs operational spend across your roadmap, enabling smarter budget allocation and tax planning.

Benefit Prioritisation: Ranking Objectives by Pure Value Delivered
When Absolute Value Matters More Than Investment Efficiency
Benefit prioritisation ranks objectives by pure value delivered—revenue gained or costs saved—over 12, 18, or 24 months. No ratios, no formulas, just pounds. The simplest framework the board will actually understand.

How to Build a Product Roadmap That Actually Works
The Human Work Most Teams Skip
Most roadmaps fail not because of poor tools, but because teams skip the human work of building consensus. Here's how to create a roadmap stakeholders actually believe in—not just tolerate.

RoadmapOne Release 3.1 is here
Tuned to perfection!
Following on from version 3, here is release 3.1 with new financial and cost modelling capabitilites.

ROI Prioritisation: Ranking the Roadmap by Return on Investment
The Timeboxed Benefit Calculator Finance Actually Trusts
ROI prioritisation ranks objectives by benefit-to-cost ratio over 12, 18, or 24 months—simpler than NPV, more financially credible than gut instinct. When finance demands numbers but won't accept spreadsheet theatre.

Capacity-Based Roadmap Planning: Why Resource Allocation Matters More Than Feature Lists
PowerPoint roadmaps promise 47 initiatives. You have 12 squads and 26 sprints. The math doesn't work. Learn how capacity-based roadmap planning forces honest conversations about what actually fits—and why showing stakeholders the capacity constraint is your secret weapon for managing expectations.

Firebreak Sprints: When Your Entire Engineering Team Needs to Stop and Fix the Foundation
SonarQube just flagged 347 critical security vulnerabilities. Your DORA metrics are in the red. A threading bug is crashing microservices across the platform. Sometimes the whole team needs to stop feature work and fix the foundation. Learn how firebreak sprints work, when to call one, and how to insert them into your roadmap without destroying delivery commitments or losing stakeholder trust.

From Objectives to Key Results: How Product Managers Lead the Discovery Breakdown
Leadership allocates objectives. Empowered teams define key results. But how does that actually happen? Discovery is the collaborative workshop where product managers facilitate the breakdown from 'Increase retention 65% to 75%' to specific, validated, measurable key results teams commit to delivering. Master this moment—it's where PM leadership matters most.

Grid vs. Timeline: Why Squad×Sprint Grids Reveal Capacity Truth That Gantt Charts Hide
Gantt charts look impressive in stakeholder presentations. They're also lying to you about what's actually possible. Timeline views hide capacity constraints, create planning illusions, and let stakeholders believe you can 'just add one more feature.' Learn why grid-based roadmap planning forces honest conversations about trade-offs—and why that honesty is your competitive advantage.

Master Roadmaps vs. Scenario Planning: How to Plan for Multiple Futures Without Losing Your Mind
What if the budget gets cut 30%? What if we pivot to enterprise? What if the acquisition happens? Scenario planning lets you explore alternatives without destroying your master roadmap. Learn how to create, compare, and convert scenarios—without the version control chaos that kills strategic planning.

Milestones in Product Roadmaps: How to Track External Events, Board Meetings, and Governance Dates Without Chaos
Most roadmap tools mix milestones with delivery work, creating confusion about what's being shipped vs. what's happening externally. Learn how to track board meetings, product launches, conferences, and regulatory deadlines as first-class roadmap elements—ensuring teams plan backwards from constraints that matter.

Time-Boxed Discovery: Why Concentrated Discovery Beats Drip-Drip Validation Every Time
Most teams let discovery drip along for months, creating context switching and unpredictable capacity drain. Time-boxed discovery sprints produce better validation outcomes while making capacity planning honest. Learn why concentrated discovery beats ongoing research—and how to implement it.

7 Common Product Discovery Mistakes (And How to Avoid Them)
Avoid the seven most common product discovery mistakes that cause teams to build the wrong things. Learn how to conduct effective discovery that validates assumptions, engages customers, and delivers business value.

Allocating Team Capacity for Product Discovery: How Much Is Enough?
Learn how to allocate the right amount of team capacity to product discovery. Practical frameworks for balancing discovery and delivery based on uncertainty, risk, and product lifecycle stage.

Introducing RoadmapOne Version 3
Your Feedback Made This
RoadmapOne Version 3 is here—featuring full collaborative editing, first-class Discovery activities, customizable Objective Prioritisation with 15 frameworks, expanded Key Result and Objective tagging, plus major performance improvements. Built on your feedback.

Product Discovery for Remote and Distributed Teams: Making It Work Across Time Zones
Master product discovery with remote and distributed teams. Learn practical strategies for running effective customer interviews, synthesis sessions, and collaborative discovery when your team is spread across locations and time zones.

Product Discovery Metrics and KPIs: How to Measure Discovery Success
What are the key metrics for measuring product discovery success? Not interviews conducted or prototypes shipped—those are vanity metrics. Track validated learning rate, assumption-to-evidence cycle time, and outcome velocity. Here are the discovery KPIs that actually predict product success.

The Product Manager's Guide to Leading Discovery: Building Team Ownership and Engagement
Master the product manager's most critical leadership role - guiding teams through discovery to break down objectives into key results, building ownership and enthusiasm for outcomes that matter to the business.

ARR Prioritisation: Ranking the Roadmap by Recurring Revenue
When Your Customers' Cheque Size Decides Your Roadmap
ARR prioritisation ranks features by the recurring revenue at stake—letting your highest-value customers vote with their wallets. When does revenue-driven roadmapping create strategic clarity, and when does it turn your product into a consulting service?

Buy a Feature Prioritisation: The Stakeholder Budgeting Game
Gamification for Stakeholder Alignment—When Democracy Meets Budgets
Buy a Feature prioritisation turns stakeholder alignment into a budgeting game—give them fake money, price features by cost, let them buy what matters. Works brilliantly until the exec with the loudest voice monopolises the budget.

Cost of Delay Prioritisation: Quantifying the Cost of Waiting
The Economics of Waiting—When Time Is Literally Money
Cost of Delay prioritisation quantifies the economic damage from waiting—then divides by duration to find maximum value per time. Every week you delay shipping costs £X. Which features cost the most to postpone?

Kano Prioritisation: Sequencing Features by Customer Satisfaction
When Customer Delight Drives the Roadmap—But Only After the Basics Work
Kano prioritisation sequences features by customer satisfaction psychology: Must-Haves first (or your product isn't viable), then Performance, then Delighters. Ship the basics before chasing wow moments.

NPV Prioritisation: Net Present Value for Roadmap Decisions
When Finance Owns Your Roadmap (And Why That Might Be Good)
NPV prioritisation brings finance-grade rigour to roadmap decisions by calculating the present value of future cash flows. When should product teams embrace the spreadsheet complexity—and when should they run?

Payback Period Prioritisation: Ranking by Time to Recoup Investment
The Financial Metric Product People Actually Understand
Payback Period prioritisation ranks features by time to recover investment—the CFO's favourite metric because it answers 'when do I get my money back?' Simpler than NPV, more intuitive than IRR, but blind to what happens after break-even.

ICE Prioritisation: Impact × Confidence × Ease
Fast Roadmap Decisions for Teams Who Can't Afford Analysis Paralysis
Sean Ellis's ICE framework—Impact × Confidence × Ease—is RICE's scrappy younger sibling. Built for speed over precision, ICE thrives when startups need decisions today, not perfect data tomorrow.

Manual Prioritisation: When Executive Judgement Beats the Formula
Executive Override and Political Triage—When Simple Beats Scientific
Manual prioritisation—a simple 1-10 scale—is what you use when frameworks feel like theatre and executive judgment beats algorithmic scoring. It's not surrender; it's pragmatism about how decisions actually get made.
MoSCoW Prioritisation: Must, Should, Could, Won't Have
Scope Negotiation for Fixed-Deadline Projects That Can't Fail
MoSCoW—Must have, Should have, Could have, Won't have—is prioritisation stripped to its brutal essence. Perfect for fixed deadlines when stakeholders need to see exactly what gets cut if the timeline slips.

Objective Prioritisation: PIE
Potential, Importance, Ease—Prioritisation for Growth Teams Who Test Everything
Chris Goward's PIE framework—Potential × Importance × Ease—prioritises experiments and features by upside if successful. Built for growth teams optimising conversion, now used everywhere fast decisions matter.
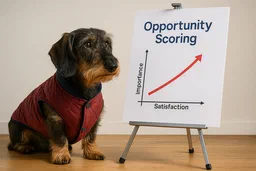
Opportunity Scoring (Ulwick): The JTBD Prioritisation Framework That Finds Unmet Customer Needs
Importance Minus Satisfaction = The Gaps Worth Closing
Ulwick's Opportunity Scoring formula (Importance + max(Importance − Satisfaction, 0)) finds the customer needs competitors miss. A practical guide to the Strategyn/JTBD prioritisation framework—with worked examples and implementation steps.
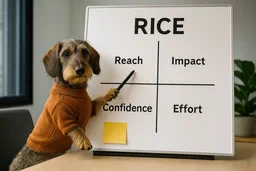
RICE Prioritisation: Reach × Impact × Confidence ÷ Effort
Data-Driven Roadmaps for Teams Who Measure Everything
Intercom's RICE framework—Reach × Impact × Confidence ÷ Effort—turns gut instinct into quantitative roadmap decisions. Learn when RICE is your best weapon, and when it betrays you.
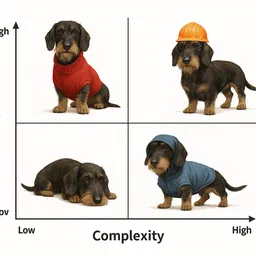
Value vs Complexity Matrix: The Visual Prioritisation Framework for Product Teams
Visual Clarity for Teams Who Think in Quadrants, Not Numbers
The Value vs Complexity Matrix is a visual 2×2 prioritisation grid that sorts every objective into Quick Wins, Major Projects, Fill-ins, or Money Pits. Plot value against complexity and see your entire roadmap at a glance.

WSJF Prioritisation: Cost of Delay ÷ Job Size (Weighted Shortest Job First)
Cost of Delay Economics for Large-Scale Agile—When It Works
WSJF (Weighted Shortest Job First) prioritises by Cost of Delay divided by Job Size. The formula: (Business Value + Time Criticality + Risk Reduction) ÷ Job Size. A practical guide to the SAFe prioritisation framework—with worked examples, Fibonacci scoring, and when WSJF fails.

Run / Grow / Transform: Gartner's Portfolio Model for Roadmap Balance
Gartner's Run Grow Transform (RGT) model categorises roadmap work into three portfolio buckets. A pragmatic guide to the model, with real allocation examples, board-level analytics, and how to tag objectives in RoadmapOne.
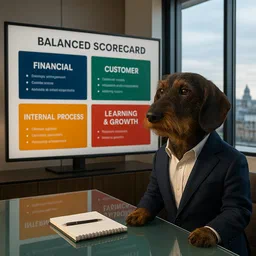
Balanced Scorecard: The Four Perspectives for Product Portfolio Strategy
Turning Strategy into Everyday Product Choices
Translating Kaplan & Norton's Balanced Scorecard into a roadmap-tagging lens that aligns product portfolios with strategy through Financial, Customer, Internal Process, and Learning & Growth perspectives.

BCG Growth-Share Matrix: Stars, Cash Cows, Question Marks & Dogs
Letting the BCG Matrix Tell You When to Milk and When to Feed
Applying the classic BCG Growth-Share Matrix (Stars, Cash Cows, Question Marks, Dogs) to product portfolios and showing how roadmap tagging clarifies funding bets.

Committed vs Stretch Goals: The OKR Distinction Google Lives By
The OKR Distinction That Separates Winners from Wishful Thinkers
Master the OKR fundamental that Google lives by—Committed goals demand 100% delivery, Stretch goals target 60-70% ambition—so boards and teams finally speak the same language about expectations.

Confidence Level %: A Living Probability Signal for Key Results
From Static Predictions to Dynamic Risk Signals
Track evolving confidence (0-100%) in achieving each key result—not as a static guess but as a living signal for when to double down, pivot, or pull the plug before it's too late.
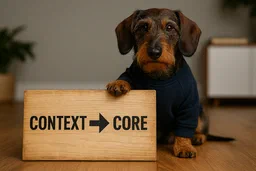
Core vs Context: Geoffrey Moore's Framework for Protecting Differentiation
Crossing the Chasm by stopping the Resource Drain on Work That Won't Win the Market
How Geoffrey Moore's Core-versus-Context distinction helps SaaS leaders protect differentiation, outsource the ordinary, and explain tough resourcing calls to the board.

Customer Journey Stages: Awareness, Consideration, Conversion & Retention
From First Touch to Loyal Advocate—Mapping Roadmap Work to Lifecycle Stages
Map your roadmap to the customer lifecycle—Awareness, Consideration, Conversion, Retention—and ensure balanced investment across every stage from first touch to loyal advocate.

Jobs-to-be-Done: Functional, Emotional & Social Jobs Customers Hire You For
Why Customers Hire Your Product—and How to Tag Your Roadmap Accordingly
Stop building features and start hiring your product for jobs—Functional tasks, Emotional desires, and Social aspirations—that reveal why customers truly choose you.
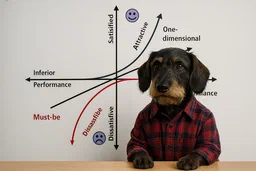
Kano Model for Product Roadmaps: Must-Have, Performance & Delighter Features
Using Kano Maps to Build Love, Not Just Loyalty
Leveraging the Kano model—Must-Have, Performance, and Delighter attributes—to balance foundational reliability with wow moments on the product roadmap.

Level of Ambition: Low, Medium, High & High-Integrity Commitments
From Moonshots to Certainties—Calibrating Stakeholder Expectations
Signal where teams stretch versus deliver with certainty—Low, Medium, High ambition, or High Integrity Commitments—so stakeholders calibrate expectations and debates shift from blame to learning.
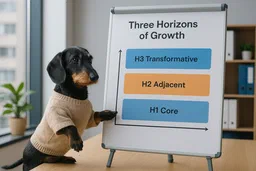
McKinsey Three Horizons Framework (H1, H2, H3): Definition, Examples & How to Apply It
The McKinsey Three Horizons framework (H1, H2, H3) splits growth initiatives across three time horizons: defend the core today (H1), build emerging businesses over 2–3 years (H2), and seed transformational bets 5–10 years out (H3). Here's how to apply it to your product roadmap with examples and common pitfalls.

Metric Type: Quantitative, Qualitative or Boolean Key Results
When Numbers Tell Half the Story—Balancing Metrics with Meaning
Balance numbers with nuance—tag key results as Quantitative (metrics), Qualitative (insights), or Boolean (yes/no outcomes) to ensure you're not optimising spreadsheets while missing the stories that matter.

Objective Tagging: SAFe Enablers vs Business Features
Giving Platform Work the Story it Deserves
Demystifying SAFe's Enabler-type backlog items and showing product teams how explicit tagging sharpens conversations with technical architects and boards alike.

Outcome vs Output vs Input: Measuring What Actually Moves the Business
The Measurement Hierarchy That Separates Motion from Progress
Stop celebrating deliverables while impact stalls—tag key results as Outcomes (impact achieved), Outputs (deliverables produced), or Inputs (activities performed) to measure what actually moves the business.

R&D Tax Credit: Making Software Claims Audit-Ready for HMRC
From Engineering Work to Tax Relief—Tagging What Qualifies
Turn qualifying R&D work into tax relief by tagging key results that prove technical uncertainty, systematic investigation, and genuine innovation—making claims audit-ready before HMRC comes knocking.
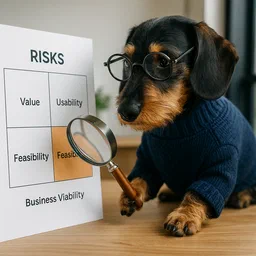
SVPG's Four Product Risks: Value, Usability, Feasibility & Viability (Marty Cagan)
Categorising Value, Usability, Feasibility, and Business Viability to de-risk the Roadmap
Marty Cagan's SVPG four product risks—Value, Usability, Feasibility, and Business Viability—give product teams a framework for de-risking every roadmap item. Tag objectives by risk type to focus discovery where it matters most.
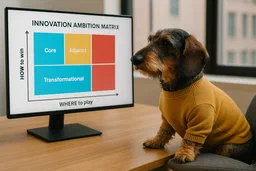
The Innovation Ambition Matrix: Core, Adjacent & Transformational (70-20-10)
Escaping the Core Comfort Zone
The Innovation Ambition Matrix (Nagji & Tuff, HBR 2012) splits your roadmap into Core (70%), Adjacent (20%), and Transformational (10%) initiatives. The twist? Returns follow the inverse ratio—70% of long-term returns come from Transformational. Here's how to tag, track, and rebalance your innovation portfolio.

Validation Method: Hypothesis-Driven vs Assumption-Based Key Results
Experiments vs Assumptions—The Difference Between Science and Wishful Thinking
Distinguish hypothesis-driven experiments from assumption-based guesses—tag how you're validating key results to expose which teams build on data and which gamble on intuition.

Size REALLY Matters: Finding the Squad Size Sweet Spot
Your Squads should be three developers, plus or minus two. Discover why squad size impacts planning effectiveness, why individual-level planning creates fragility, and how to structure teams for accountability and successful delivery.

Start with Why: Why We Are Building RoadmapOne
In 'Start with Why', Simon Sinek's proposes that great leaders and organizations inspire action by first explaining *why* they do what they do before explaining *what* they do or *how* they do it. So here's our Why...
