S-Curves in Product Strategy: When to Jump to the Next Curve
The S-curve is arguably the most important shape in product strategy. Nearly every product, every technology, every performance dimension improves along an S-shaped trajectory — slow progress at first, then rapid acceleration, then diminishing returns as the technology approaches its natural limits.
For a product leader, the single hardest strategic question is:
When is our current S-curve flattening, and when should we jump to the next one?
Jump too early and you abandon a product that still has years of growth in it. Jump too late and you miss the window — a competitor on the next curve has already captured the market and you’re defending a declining business with no clear replacement. Both failure modes are common, and both are governance failures as much as technology failures.
An S-curve describes the typical performance trajectory of a product or technology over time: slow early progress, rapid middle acceleration, and late-stage diminishing returns as limits are approached. Most products, technologies, and adoption phenomena follow an S-curve. Successful companies must identify when their current curve is flattening and commit dedicated capacity to a next S-curve before the current one declines — a strategic move known as “S-curve jumping”.
TL;DR: In PE and NED work I see S-curve transitions mishandled more often than any other strategic decision. The pattern is always the same: the current product is still growing, margins are good, the team is optimistic. Nobody wants to invest seriously in the next curve because the current curve hasn’t flattened yet. Eighteen months later, growth has stalled, margins are compressing, and the board belatedly asks “what’s our next S-curve?” — at which point it’s too late to build it from scratch. The good news: with AI compressing build timelines, the jump is cheaper than it used to be. The bad news: the window is also shorter.
What an S-Curve Actually Is
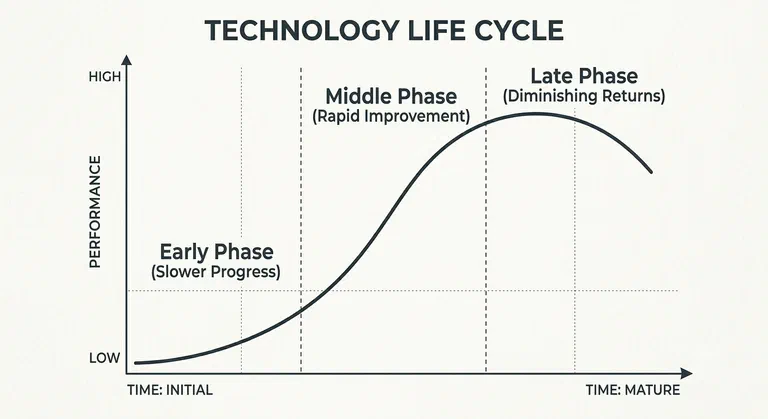
An S-curve plots performance (or sales, or adoption) against time or effort. Three distinct phases:
- Early phase — slow progress. You are learning the technology, building the foundational capabilities, attracting innovators. Returns on effort are low because you’re figuring it out.
- Middle phase — rapid improvement. Core mechanisms are working. Each incremental investment produces step-changes in capability. This is where most of the commercial value gets generated.
- Late phase — diminishing returns. The technology approaches its physical, economic, or market limits. Every incremental improvement costs more than the one before. Competitors can catch up because the frontier has stopped moving.
The canonical examples: sailing ships vs. steamships; vacuum tubes vs. transistors; HDDs vs. SSDs; 3G vs. 4G vs. 5G. In each case the incumbent technology was still being improved — sometimes dramatically — when the substitute technology started its own S-curve. The company committed to the incumbent curve lost the market, even while getting better at the thing they’d always been good at.
Clayton Christensen’s work on the Innovator’s Dilemma is essentially a disruption-centric read of S-curve transitions: incumbents optimise the current curve while disruptors start a new one at its early phase, and by the time the disruptor’s curve intersects mainstream requirements the incumbent has lost. The S-curve provides the shape; disruption theory explains why incumbents so often fail to jump.
More recent thinking from Larry Downes and Paul Nunes (Big Bang Disruption, 2014) argues that in digital markets the classic S-curve is sometimes flattened into a shark fin — almost no early learning phase, immediate steep growth, and an equally steep decline as the next wave arrives. The pace of AI-era product development pushes many software categories toward this shape: shorter cycles, less time to respond, and far smaller margin for error in transition timing.
Product-side case studies where S-curve transitions defined company survival:
- Kodak dominated the film S-curve, invented the digital camera in 1975, and failed to commit to the digital S-curve until the film curve had collapsed. Bankruptcy followed.
- Netflix made two explicit S-curve jumps — DVD-by-mail to streaming (2007), and licensed content to originals (2013) — each committed to before the prior curve flattened.
- Microsoft recognised the flattening of the on-premise software S-curve and committed to the cloud S-curve under Satya Nadella from 2014. Azure’s trajectory is the result.
- Blockbuster, Blackberry, and Nokia are the inverse cases — each could have jumped to the next curve but governance and customer loyalty to the current curve prevented it.
The Connection to Other Lifecycle Frameworks
S-curves are not a standalone framework — they’re the shape that underlies most of the lifecycle models in this cluster:
- The product life cycle curve (introduction → growth → maturity → decline) is an S-curve with a decline tail.
- Rogers’ diffusion of innovations adoption curve is an S-curve (the cumulative version of the normal distribution across adopter categories).
- The Gartner Hype Cycle is emphatically not an S-curve — it’s a curve of market expectations, not technology performance. Don’t conflate them.
- Three Horizons is effectively a portfolio of S-curves at different stages of maturity.
Understanding the S-curve is what lets you reason about all of the above as a single coherent problem: the decision of when to invest in the current curve vs. when to bet on the next one.
Leading Indicators That Your S-Curve Is Flattening
Most teams identify a flattening S-curve too late, when revenue growth has already stalled. The real signal is earlier — in the effort-to-improvement ratio. Leading indicators:
- Feature velocity constant, but customer-perceived value per feature is falling. You’re shipping the same amount but customers shrug.
- Costs of each new feature are rising. Code complexity, integration burden, testing overhead all growing faster than the value they unlock.
- Customer requests becoming smaller and more specific. Instead of requesting major capabilities, customers are asking for polish, configurability, or edge-case handling.
- Competitor differentiation is commoditising. Features that used to be differentiators are table-stakes across the whole category.
- New customer acquisition slowing even as product has improved. The remaining market isn’t convinced by the next increment.
- Pricing power weakening. You can’t raise prices without losing customers — a clear sign the perceived marginal value has declined.
Any two of these simultaneously is a strong signal that your current S-curve is in late phase. That’s not a reason to panic — late-phase S-curves can still be highly profitable. It’s a reason to start deliberately seeding the next curve.
Seeding the Next S-Curve: The Minimum Viable Bet
The cardinal rule of S-curve transitions: you have to seed the next curve while the current one is still growing. Waiting until the current curve flattens is too late — the next curve takes years to mature, and your competitors are already further along theirs.
The operational implementation is the minimum viable new-product team: 2 engineers and 1 product person, dedicated, with a proper business case and targets someone will stand behind. Most companies can afford this. What they can’t afford is never making the bet.
At any given moment, a well-run product portfolio should have:
- 60–70% of capacity on the current S-curve — where most revenue and most margin lives
- 20–25% on the next S-curve candidates — dedicated bets that could become the replacement
- 5–10% on discovery and early options — innovation-trigger exploration of technologies or markets that might matter in 5+ years
This is essentially the Three Horizons portfolio expressed in S-curve terms. The error I see most often is companies with 95% on the current curve, 3% on “innovation projects” that are actually feature work on the current curve, and 2% on speculative bets with no dedicated team. That portfolio will die at the next S-curve transition — not because it can’t see the transition coming, but because it has nothing to transition to.
The AI Era: Faster Curves, Compressed Windows
AI has changed the economics of S-curve transitions in two directions, which partially cancel and partially don’t.
The good news: The cost of seeding a next-curve bet has collapsed. Where in 2019 you might need six engineers and a year to build a credible MVP of a next-curve product, in 2026 two engineers can do it in a quarter. This makes the minimum viable new-product team dramatically more affordable and the opportunity cost of not seeding lower than ever.
The bad news: Competitors can seed next-curve bets at the same speed. The window to establish position on a new S-curve is shorter, because more entrants can move in parallel. And distribution — which AI hasn’t made cheaper — is still the thing that determines who wins the next curve. Small companies with strong distribution assets will beat bigger incumbents with slower governance, even when the incumbent has more resources.
The net effect: the strategic cost of being slow on S-curve transitions has gone up. In 1990s hardware you had years to notice and respond. In 2026 software you may have quarters.
Jumping Too Early, Jumping Too Late
The two failure modes are equally common:
Jumping too early
You abandon a current S-curve that still had 3–5 years of growth left. You pivot the company to chase a next-curve opportunity before the technology or market is ready, at the cost of capacity that was productively deployed on the current curve. The product you were doing well on stalls because you withdrew investment; the next-curve bet also stalls because it was too early. Now you have two failing products.
Common drivers: CEO FOMO on an emerging technology (see the Hype Cycle failure modes ); a new leader wanting to make their mark; a bad quarter triggering a strategic rethink.
Jumping too late
You keep investing heavily in the current curve even as its returns diminish, telling yourself the plateau is temporary. The next-curve bet is quietly deprioritised because “we don’t have capacity right now.” By the time growth has obviously stalled, a competitor is already dominant on the next curve and your next-curve bet is 18 months behind — which in AI-era software is effectively forever.
Common drivers: current-curve customers shouting loudest (the Innovator’s Dilemma in action ); internal career incentives pointing at current-curve success; board under-estimating transition urgency because the revenue numbers still look fine.
The discipline that protects against both
The protection against both failure modes is the same: deliberate portfolio allocation with dedicated teams. If you have a defined 20% of capacity on next-curve bets with their own teams and their own metrics, you protect against jumping too early (because the current curve retains 70%+) AND against jumping too late (because the next curve is already seeded and growing when the transition accelerates).
What kills you is accidental allocation. Companies that let engineering leaders and product managers allocate capacity based on quarterly pressure inevitably end up with 95% on current-curve and nothing on next-curve — because quarterly pressure is always about the current curve.
The Adjacent-Pool S-Curve: Where PE Plays Win
The most commercially attractive S-curve transitions aren’t usually pure technology substitutions — they’re moves into adjacent pools of value using your existing distribution asset.
Your mature product’s real asset is not its feature set; it’s the customer relationship, the sales motion, the trust you’ve built, the data you have. Those are worth more when combined with an adjacent product than when used only to sell the current product. The next S-curve for a mature SaaS business is often not a technology leap — it’s a second or third product sold to the same customers through the same channel.
This is why I harp on about the Ansoff Matrix in PE work. The market-development and product-development quadrants are where most S-curve transitions for mature companies actually happen — not through heroic technology bets but through systematic exploitation of distribution assets. And because AI has collapsed the cost of building those adjacent products, the economics have shifted dramatically in favour of attacking adjacencies rather than waiting for competitors to attack yours.
The Board / NED Diagnostic for S-Curve Risk
Here is the conversation I want to have with every portfolio company leadership team annually:
- Where is our main product on its S-curve? Not a hand-wave — a honest assessment of whether we’re in rapid acceleration, late phase, or flattening.
- What are the leading indicators telling us? Feature velocity, cost per feature, pricing power, customer acquisition — any declining?
- What is our next-curve bet? Named, with a dedicated team, a business case, and targets. If we don’t have one, why not?
- What percentage of capacity is on current vs. next curve? And is that ratio consistent with where each curve actually is?
- What would we do if a competitor launched a credible next-curve product this quarter? If the answer is “we’d respond,” respond with what, exactly? A team that doesn’t exist?
Most leadership teams can’t answer most of these questions confidently. That’s the warning sign.
How RoadmapOne Helps
RoadmapOne lets you tag each objective by S-curve status — current, next, or discovery. The capacity analytics then show what percentage of your engineering and product capacity is on each. Most teams who run this analysis are surprised by the result. Almost always they have less allocated to the next curve than they believed; often they have nothing at all.
Frequently Asked Questions
What is the S-curve in technology?
The technology S-curve plots a technology’s performance against the effort or investment poured into it. Early progress is slow while the fundamentals are worked out, then improvement accelerates sharply as the approach matures, then flattens as the technology approaches its physical or architectural limits. The strategic point is that late-curve effort buys very little: doubling investment in a flattening technology rarely doubles anything.
What is the S-curve in technology improvement?
It describes the diminishing-returns pattern in technology improvement: the same engineering effort produces large gains mid-curve and marginal gains late-curve. This is why “we just need to try harder on the current platform” is usually the wrong answer for a mature system. The signal to watch is cost per unit of improvement — when it starts climbing steeply, you are on the flat part of the curve and the next curve needs seeding.
What is the S-curve in technology forecasting?
In technology forecasting, the S-curve is used to project how far and how fast a technology will improve before it saturates, and therefore when a successor technology is likely to overtake it. Forecasters fit historical performance data to the curve and look for the inflection point. The practical use for product leaders is timing: it tells you roughly how long your current curve has left, which is what determines when a next-curve bet needs funding.
What is the S-curve in product management?
The S-curve describes the typical trajectory of a product or technology’s performance over time — slow improvement early, rapid acceleration in the middle, and diminishing returns late. Understanding where a product sits on its S-curve helps product leaders decide where to invest capacity.
What is the S-curve in business?
In business, the S-curve plots growth — revenue, adoption, or market share — against time. New ventures grow slowly while they find product-market fit, accelerate rapidly once the model works, then flatten as the market saturates. The strategic value is the warning it gives: when growth starts to flatten, you need a next S-curve already seeded, because building one from scratch takes years.
What is S-curve growth?
S-curve growth is the pattern where a product, technology, or company grows slowly at first, then enters a steep acceleration phase, then plateaus as it approaches the limits of its market or technology. The shape matters because the flattening phase looks like success — revenue is still high — right up until growth stalls, which is why so many companies miss the moment to jump to the next curve.
How do I know when an S-curve is flattening?
Leading indicators include: feature velocity constant but customer-perceived value falling, cost per feature rising, customer requests becoming smaller and more specific, competitor differentiation commoditising, new customer acquisition slowing, pricing power weakening. Any two of these simultaneously is a strong signal of late-phase S-curve.
What is S-curve jumping?
The deliberate strategic move from one S-curve to the next — replacing a maturing product or technology with a new one that has more growth ahead. The hard part is timing: too early and you abandon a still-productive curve; too late and a competitor on the next curve has already captured the market.
How does the S-curve relate to the product life cycle?
The product life cycle (introduction → growth → maturity → decline) is essentially an S-curve with a decline tail added. The S-curve lens focuses on the relationship between effort and improvement; the product life cycle focuses on sales trajectory. Both describe the same underlying dynamic.
Is the S-curve relevant for software and SaaS products?
Very. Software products follow S-curves both at the product level (feature depth, customer value) and at the technology level (the underlying tech stack). SaaS companies often need to jump S-curves twice — once at the technology level, and separately at the product-market level.
How many S-curves can a company run simultaneously?
Most companies can productively run 2–3: the current main-revenue curve, one or two next-curve bets with dedicated teams, and a small discovery allocation for early-stage options. Running more than this spreads capacity too thin; running fewer leaves you exposed when the main curve flattens.
Conclusion
The S-curve is the shape that governs almost every strategic decision in technology. Knowing where your product sits on its curve, and knowing what you’re doing to seed the next curve, is the minimum bar for responsible product leadership.
Most failure modes come from denial — “our growth is still strong” — and from accidental capacity allocation that lets the current curve consume 100% of resource. The fix isn’t complicated. Honest assessment of where you are, deliberate allocation of dedicated teams to next-curve bets, and the governance discipline to protect those bets from quarterly pressure. Most companies won’t do it. The ones that do will own the next decade.
