OKR Examples for Product Teams: 30+ Objectives and Key Results That Actually Work
Problems to Solve, Not Features to Build
There are hundreds of OKR example lists on the internet. Most are useless. They give you generic statements like “Improve customer satisfaction” with key results like “Increase NPS by 10 points.” They sound reasonable. They teach you nothing. You paste them into a spreadsheet and nothing changes.
The problem isn’t the format. The problem is that most OKR examples are features disguised as objectives—or worse, vague aspirations with no connection to the business problems your board actually cares about.
Good OKRs start with a problem to solve, not a thing to build. As Marty Cagan emphasises in the product operating model : leadership provides the problems (Objectives), and empowered teams discover the solutions (Key Results and the initiatives to achieve them). The Objective should be something a CEO, CFO, or board member would instantly recognise as important to the business. If your Objective wouldn’t survive a board meeting, it’s not an Objective—it’s a task.
This article provides 30+ OKR examples for product teams, organised by the problems they solve. Every example follows three rules:
- The Objective is a business problem, not a feature
- The Key Results are measurable outcomes, not activities
- The team is free to discover the best solution—the OKR doesn’t prescribe how
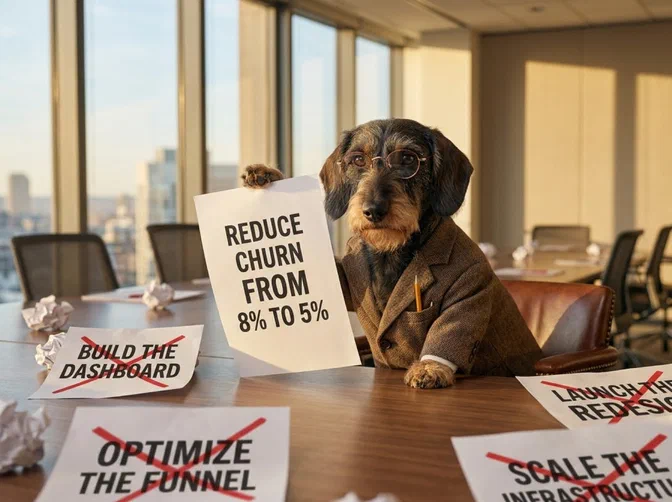
TL;DR: When I coach product teams, I start with simple, concrete Objectives that a board member would recognise: improve onboarding conversion by X%, get Y customers to adopt package P, reduce cloud costs by £Z/month. The penny drops when teams realise that “Build the new onboarding flow” isn’t an Objective—it’s one possible solution to the Objective of “Increase activation rate from 35% to 55%.” That shift—from building what you’re told to solving problems you own—is what makes OKRs transformative.
How to Read These Examples
Each example follows a consistent structure:
- Objective — the business problem to solve (what a CEO would care about)
- Key Results — 2–4 measurable outcomes (how you’ll know the problem is solved)
- What the team might build — possible solutions the team could discover (not prescribed)
- RGT tag — whether this is Run, Grow, or Transform work
The “What the team might build” section is deliberately separated from the OKR itself. The team owns the solution. The OKR defines success; the team discovers the path.
For more on the relationship between OKRs and KPIs , and why the distinction matters, see our companion guide.
Activation & Onboarding
These Objectives target the critical gap between a customer signing up and getting value. At Trainline, conversion was our North Star metric , and activation was where we found the biggest leverage. In the Pirate Metrics framework, this is the “A” that most organisations under-invest in.
Example 1: Activation Rate Crisis
Objective: Solve the new-user activation crisis — 60% of signups never reach the product’s core value
Key Results:
- Increase activation rate from 35% to 55%
- Reduce time-to-value from 14 days to 3 days
- Achieve Day-7 retention of 40% (from 22%)
What the team might build: Guided onboarding wizard, default templates, simplified first-run experience, proactive support outreach for stuck users.
RGT: Grow | Why it matters: A 20-point activation lift at scale compounds through the entire funnel. Slack discovered that teams exchanging 2,000 messages almost never churned—their activation metric drove everything downstream.
Example 2: Trial-to-Paid Conversion
Objective: Convert more trial users into paying customers
Key Results:
- Increase trial-to-paid conversion from 12% to 20%
- Reduce time-to-first-paid-action from 8 days to 3 days
- Achieve 85% onboarding completion rate (from 52%)
What the team might build: Streamlined checkout, in-trial feature prompts, usage-triggered upgrade nudges, simplified pricing page.
RGT: Grow
Example 3: Enterprise Onboarding Speed
Objective: Make enterprise customers productive in days, not months
Key Results:
- Reduce average enterprise time-to-go-live from 90 days to 30 days
- Achieve 90% data migration success rate on first attempt
- Reach customer satisfaction score of 4.5/5 for onboarding experience
What the team might build: Self-serve migration tools, implementation playbooks, API-driven data import, dedicated onboarding sandbox.
A note on “average” in the first Key Result: for enterprise onboarding, a distribution-aware measure is almost always better (“p80 time-to-go-live < 45 days”) because users do not experience averages — the customer stuck at 120 days is the one who churns, and an average hides them entirely.
RGT: Grow
Retention & Churn
Churn is the silent killer. A 2-point churn reduction on a £50M ARR base is worth £1M without a single sales call. These Objectives target the Retention stage of the funnel—work that often gets buried under KTLO or ignored entirely.
Example 4: New-Customer Churn
Objective: Stop the bleeding — new customers are leaving faster than we can acquire them
Key Results:
- Reduce 90-day churn from 25% to 12%
- Increase NPS among customers in first 90 days from 18 to 40
- Achieve 70% feature adoption for core workflow within 30 days of activation
What the team might build: Proactive health scoring, in-app guidance for underused features, customer success automation, churn prediction model.
RGT: Grow | Why it matters: At B2B SaaS companies, average monthly churn is 3.5%. Enterprise targets below 1%. If your 90-day churn is 25%, you’re filling a leaky bucket.
Example 5: Net Revenue Retention
Objective: Grow revenue from existing customers faster than we lose it
Key Results:
- Increase Net Revenue Retention from 95% to 115%
- Grow expansion revenue from 8% to 18% of total MRR
- Reduce involuntary churn (failed payments) from 1.2% to 0.3%
What the team might build: Usage-based upsell triggers, plan recommendation engine, payment retry logic (dunning), annual plan incentives.
RGT: Grow | Why it matters: Best-in-class SaaS companies achieve NRR above 130% (Snowflake hit 158%). An NRR above 100% means you’d still grow even if you stopped acquiring new customers.
Example 6: Engagement Depth
Objective: Make the product indispensable to daily workflows
Key Results:
- Increase DAU/MAU ratio from 15% to 30%
- Increase average sessions per user from 3/week to 7/week
- Reduce percentage of “dormant” accounts (no login in 30 days) from 40% to 15%
What the team might build: Daily digest emails, workflow integrations (Slack, Teams), notification improvements, habit-forming feature loops.
RGT: Grow
Revenue & Monetisation
Revenue Objectives should be framed around the levers product teams can actually influence—conversion, pricing, expansion—not top-line revenue targets that depend on sales, marketing, and market conditions.
Example 7: Pricing Optimisation
Objective: Our pricing doesn’t reflect the value we deliver — close the gap
Key Results:
- Increase Average Revenue Per Account (ARPA) from £85/mo to £110/mo
- Achieve 90% customer acceptance rate on new pricing (less than 10% downgrade)
- Reduce pricing-related support tickets by 50%
What the team might build: Value-metric based pricing tiers, usage dashboards that make value visible, grandfathering strategy for existing customers, pricing page A/B tests.
RGT: Grow
Example 8: Self-Serve Revenue
Objective: Reduce our dependence on expensive sales-led deals
Key Results:
- Grow self-serve revenue from 20% to 40% of total MRR
- Achieve self-serve CAC below £50 (versus £800 for sales-led)
- Reach 500 self-serve customers (from 120)
What the team might build: Free trial improvements, in-product upgrade flows, self-serve billing portal, automated product-qualified lead scoring.
RGT: Grow | Why it matters: This is a product-led growth play. Self-serve CAC is typically 10-20x lower than sales-led. Shifting the mix fundamentally changes unit economics.
Example 9: Expansion Revenue from Existing Customers
Objective: Get 200 customers to adopt Premium package
Key Results:
- 200 customers upgraded from Standard to Premium (from current base of 40)
- Achieve upsell conversion rate of 15% among customers using >80% of Standard features
- Premium customer NPS exceeds 55
What the team might build: In-app “you’ve hit the limit” nudges, Premium feature previews, ROI calculator for Premium upgrade, customer success-led expansion campaigns.
RGT: Grow
Cost Reduction & Operational Efficiency
Not every Objective is about growth. Sometimes the board’s priority is reducing burn rate, cutting infrastructure costs, or improving operational efficiency. These are legitimate business problems—and they belong on the roadmap.
Example 10: Cloud Cost Reduction
Objective: Reduce cloud infrastructure costs by £150K/month without degrading performance
Key Results:
- Reduce monthly AWS spend from £420K to £270K
- Maintain p95 API response time below 200ms
- Achieve zero customer-impacting incidents caused by infrastructure changes
What the team might build: Right-sizing compute instances, reserved instance purchasing, caching layer improvements, database query optimisation, serverless migration for batch workloads.
RGT: Run | Why it matters: Infrastructure cost per user is a key metric for SaaS unit economics. The performance guardrail Key Results prevent the classic failure of cost-cutting that degrades the product.
Example 11: Support Cost Reduction
Objective: Reduce the support burden that’s consuming 15% of engineering time
Key Results:
- Reduce support ticket volume from 800/month to 300/month
- Increase self-serve resolution rate from 20% to 60%
- Reduce average engineering time spent on support from 15% to 5%
What the team might build: Knowledge base improvements, in-app contextual help, error message rewrites, self-service troubleshooting flows, most-common-issue automation.
RGT: Run
Example 12: Deployment Speed
Objective: Our release process is killing velocity — ship faster without breaking things
Key Results:
- Increase deployment frequency from weekly to daily
- Reduce lead time for changes from 10 days to 2 days
- Maintain change failure rate below 5%
What the team might build: CI/CD pipeline improvements, automated testing, feature flags, canary deployments, observability tooling.
RGT: Run | Why it matters: These are DORA metrics —the research shows elite teams are both faster and more stable. Google targets deployments multiple times per day with change failure rates under 15%.
Market Expansion
Market expansion Objectives are inherently riskier—you’re taking something that works in one context and applying it to another. Innovation Ambition Matrix would classify most of these as Adjacent.
Example 13: Geographic Expansion
Objective: Expand into Sweden — our first Nordic market
Key Results:
- Achieve 500 paying customers in Sweden within 6 months
- Reach £50K MRR from Swedish customers
- Achieve Swedish customer NPS within 10 points of UK NPS
What the team might build: Swedish localisation, local payment methods (Swish, Klarna), Swedish compliance requirements, local content, partnerships with Swedish industry bodies.
RGT: Grow
Example 14: New Segment
Objective: Win the mid-market — we’re strong in SMB but losing enterprise deals to competitors
Key Results:
- Close 15 customers with ACV >£50K (from current 3)
- Reduce enterprise sales cycle from 9 months to 4 months
- Achieve feature parity on top 5 enterprise requirements (SSO, SCIM, audit logs, SLAs, dedicated support)
What the team might build: SSO/SCIM integration, admin console, audit logging, custom SLAs, enterprise onboarding programme.
RGT: Grow
Compliance & Regulatory
Compliance work has extreme time criticality —miss a deadline and the consequences aren’t just lost revenue, they’re fines, shutdowns, or legal liability. These Objectives often score highest on WSJF even when their business value seems low.
Example 15: Regulatory Compliance
Objective: Achieve full compliance with the new data protection regulation before the September deadline
Key Results:
- Pass external compliance audit with zero critical findings
- Complete data processing inventory for 100% of customer data flows
- Achieve 72-hour response time for all Data Subject Access Requests (currently 21 days)
What the team might build: Consent management system, data deletion automation, DSAR workflow tooling, data processing register, privacy impact assessment templates.
RGT: Run | Why it matters: This is a Must-Have in Kano terms —absence creates catastrophic downside, presence generates zero excitement. It must be done; the OKR ensures it’s done well.
Example 16: Security Posture
Objective: Achieve SOC 2 Type II certification to unblock enterprise sales pipeline
Key Results:
- Pass SOC 2 Type II audit by Q4
- Reduce mean time to detect security incidents from 48 hours to 1 hour
- Achieve 100% completion of quarterly access reviews
What the team might build: SIEM implementation, automated access review tooling, encryption-at-rest for all data stores, incident response playbooks, vendor security assessment process.
RGT: Run
Product Quality & Reliability
These are the crown jewel Objectives—protecting and improving the capabilities that customers depend on every day.
Example 17: Platform Reliability
Objective: Our customers can’t trust us — three major outages in two months is unacceptable
Key Results:
- Achieve 99.95% uptime (from 99.2%)
- Reduce P1 incidents from 8/month to 1/month
- Reduce mean time to recovery from 4 hours to 30 minutes
What the team might build: Redundancy improvements, automated failover, chaos engineering, on-call process improvements, runbook automation.
RGT: Run
Example 18: Performance
Objective: Our product feels slow — customers are complaining and it’s showing up in loss reports
Key Results:
- Reduce page load time from 4.2 seconds to under 1.5 seconds
- Achieve p95 API response time under 200ms (from 800ms)
- Reduce performance-related support tickets from 120/month to under 20
What the team might build: CDN implementation, database query optimisation, frontend code splitting, caching layer, image optimisation pipeline.
RGT: Run | Why it matters: Performance is a Kano Must-Have that has drifted. Customers expect fast. When you’re slow, they don’t complain—they leave.
Customer Experience
Example 19: Customer Satisfaction Crisis
Objective: Our NPS has dropped below 20 — find out why and fix it
Key Results:
- Increase NPS from 18 to 35
- Reduce “detractor” responses from 40% to 20%
- Achieve first-response time on support tickets under 2 hours (from 18 hours)
What the team might build: Closed-loop NPS follow-up, support SLA automation, top-5-complaint root cause analysis and fix programme, customer advisory board.
RGT: Run
Example 20: Mobile Experience
Objective: Our mobile conversion is half of desktop — close the gap
Key Results:
- Increase mobile conversion from 2.1% to 4.0%
- Reduce mobile checkout abandonment from 68% to 35%
- Achieve mobile app store rating of 4.5 stars (from 3.2)
What the team might build: Mobile checkout redesign, Apple Pay / Google Pay integration, guest checkout, mobile-specific performance optimisation, responsive design improvements.
RGT: Grow | Why it matters: At Trainline, conversion was our North Star metric . Mobile conversion specifically was where we found the biggest opportunity—improving it was worth millions in incremental revenue.
Discovery & Innovation
These Objectives target the Transformational end of the portfolio—work where the outcome is validated learning, not immediate revenue.
Example 21: Validate a New Market Opportunity
Objective: Determine whether there’s a viable market for our platform among mid-size accounting firms
Key Results:
- Conduct 30 customer discovery interviews with target segment
- Achieve “strong interest” signal from 40%+ of interviewees (defined as: would pay >£200/mo)
- Build and test a prototype with 5 firms; achieve Task Success Rate >80%
What the team might build: Research interview script, landing page test, clickable prototype, competitive analysis, pricing sensitivity survey.
RGT: Transform | Why it matters: This is pure product discovery . The Key Results measure validated learning, not features shipped. If the interviews reveal no market, killing the initiative is a successful outcome—you saved months of wasted engineering.
Example 22: AI Integration Feasibility
Objective: Understand whether AI can meaningfully improve our core workflow — before we bet a quarter on it
Key Results:
- Build 3 working prototypes demonstrating different AI integration approaches
- Achieve user preference score above 7/10 in prototype testing with 20 customers
- Confirm technical feasibility: response time under 2 seconds, accuracy above 90%
What the team might build: Proof-of-concept prototypes, customer testing sessions, technical spikes, cost modelling for AI infrastructure.
RGT: Transform
Internal & Enabling
These Objectives improve the organisation’s ability to deliver—developer experience , tooling, and ways of working.
Example 23: Developer Productivity
Objective: Our engineers spend more time fighting the build system than building product
Key Results:
- Reduce build time from 15 minutes to under 3 minutes
- Increase developer satisfaction score from 5.8/10 to 7.5/10
- Reduce time-to-first-commit for new hires from 2 weeks to 3 days
What the team might build: Build system overhaul, local development environment improvements, developer onboarding playbook, developer experience survey and feedback loop.
RGT: Run
Example 24: Data-Informed Decision Making
Objective: We’re making product decisions on gut feel — build the evidence base
Key Results:
- 80% of shipped features have pre-ship hypothesis and post-ship measurement (from <10%)
- Reduce time from question to data insight from 2 weeks to 2 hours
- Achieve self-serve analytics adoption across 100% of product squads
What the team might build: Product analytics platform, self-serve dashboards, experiment framework, data literacy training programme.
RGT: Run | Why it matters: This closes the feedback loop. Without outcome measurement, teams have no way to know whether their OKRs actually worked. The insidious failure mode is shipping features, not tracking usage, and congratulating yourself.
Real-World OKR Examples from Known Companies
Most “company OKR examples” on the internet are hypothetical. These are verified examples from John Doerr’s Measure What Matters and public disclosures.
Intel — Operation Crush (1979)
The OKR that started it all. Andy Grove invented OKRs at Intel to fight Motorola’s 68000 chip.
Objective: Establish the 8086 as the highest-performance 16-bit microprocessor family
Key Result: Win 2,000 design wins for the 8086 processor family
By Q3 1980, they were on track. By year-end, Motorola was routed. No Intel product was modified—they revamped positioning to play to the company’s systems and services strengths. The Objective was clear enough that every team could align without being told what to do.
Google Chrome — Sundar Pichai’s Stretch Goals (2008–2010)
Objective: Build the best browser
| Year | Key Result Target | Actual Result |
|---|---|---|
| 2008 | 20 million 7-day active users | <10 million (missed) |
| 2009 | 50 million 7-day active users | 37 million (missed) |
| 2010 | 100 million 7-day active users | 111 million (exceeded) |
Pichai deliberately set stretch goals he knew he’d miss. “It took courage to write an OKR that might well fail, but there was no other way if we wanted to be great.” This is the canonical example of ambitious OKRs—Google expects 70% achievement on stretch goals.
YouTube — The Billion-Hour Goal (2012–2016)
Objective: Reach 1 billion hours of daily user watch time (a 10x increase)
The team made approximately 150 incremental changes, each contributing roughly 0.2% to watch time. Hit the target in October 2016, two months ahead of schedule. But this is also a cautionary tale—the singular focus on watch time arguably incentivised algorithmic promotion of sensationalist content, leading to later controversy. Guardrail metrics matter.
Healthcare.gov — The Emergency Fix (2013)
When Healthcare.gov crashed on launch, Google SRE Mikey Dickerson wrote this on a whiteboard:
Objective: Fix Healthcare.gov for the vast majority of people
Key Results:
- 70% of people get through
- 1-second response time
- 1% error rate
- 99% uptime
Four Key Results. Crystal clear. Measurable. No ambiguity. This is what good OKRs look like under pressure.
The Bad-to-Good Rewrite: 10 Feature Objectives Transformed
The most common OKR mistake is disguising features as Objectives. Here are 10 rewrites—from what teams typically write to what a board would actually care about.
| # | Bad Objective (Feature) | Good Objective (Problem) | Why It’s Better |
|---|---|---|---|
| 1 | Build new onboarding flow | Increase activation rate from 35% to 55% | Team discovers the right solution; might not be onboarding |
| 2 | Launch mobile app redesign | Increase mobile conversion from 2.1% to 4.0% | Measures the outcome the business cares about |
| 3 | Migrate to microservices | Increase deployment frequency from weekly to daily | The migration is a means, not an end |
| 4 | Implement SSO | Unblock £600K in enterprise renewals blocked on security | Connects to revenue; SSO is one possible solution |
| 5 | Build reporting dashboard | Reduce time-to-insight from 2 hours to 5 minutes | The dashboard might not be the best solution |
| 6 | Add Stripe integration | Reduce payment failure rate from 12% to 2% | Multiple payment solutions might solve this |
| 7 | Redesign the settings page | Reduce settings-related support tickets by 80% | Measures the actual user pain |
| 8 | Build an API | Enable 10 partner integrations generating £200K ARR | The API is the means; partner revenue is the end |
| 9 | Launch in Germany | Achieve 500 paying German customers within 6 months | “Launch” is an output; customers are the outcome |
| 10 | Implement AI chatbot | Resolve 50% of support queries without human intervention | AI is one approach; the outcome is reduced support load |
In every case, the good Objective passes the board test: would a CEO or CFO read this and immediately understand why it matters?
For more on why this distinction matters, see our guide to OKRs vs KPIs and the product operating model .
Tagging OKR Examples by Run / Grow / Transform
One thing no other OKR examples article does is show how Objectives map to portfolio balance . Here’s a summary of all the examples above, tagged:
| Tag | Count | Examples |
|---|---|---|
| Run (maintain the business) | 8 | Cloud costs, support burden, deployment speed, compliance, security, reliability, performance, NPS crisis, developer productivity, data-informed decisions |
| Grow (expand the business) | 9 | Activation, trial conversion, enterprise onboarding, churn, NRR, engagement, pricing, self-serve revenue, package adoption, mobile conversion, geographic expansion, new segment |
| Transform (create the future) | 2 | New market validation, AI feasibility |
A balanced roadmap might allocate 30% Run, 50% Grow, 20% Transform. If your OKRs are 90% Run, you’re keeping the lights on but not growing. If they’re 90% Grow, you’re probably accumulating technical debt and KTLO problems. In RoadmapOne , you can see this balance at a glance.
From OKRs to the Roadmap
OKR examples are useful. But they only become powerful when they’re connected to actual squad allocation and capacity planning .
Here’s how OKRs translate to the roadmap in RoadmapOne:
- Leadership sets 3–5 Objectives for the quarter — the business problems that matter most
- Each Objective is allocated to a squad (or multiple squads for cross-team outcomes)
- Squads define their own Key Results — the specific, measurable outcomes they’ll pursue
- The roadmap grid shows which squads are pursuing which Objectives, across which sprints, with what capacity
- Analytics show portfolio balance — Run/Grow/Transform , SVPG risk types , Innovation Ambition
This is the handshake between empowered teams and the business. The board sees Objectives they care about with capacity allocated. The teams see problems they’re empowered to solve. Both sides can see whether the portfolio is balanced.
Without this connection, OKRs are just words on a slide. With it, they’re the operating system of your product organisation.
Conclusion
Good OKRs have three characteristics: the Objective is a business problem a board member would recognise, the Key Results are measurable outcomes (not activities), and the team is empowered to discover the best solution.
Most OKR examples fail because they’re features dressed as objectives. “Build the new onboarding flow” sounds like an OKR but it isn’t—it prescribes the solution and doesn’t measure the outcome. “Increase activation rate from 35% to 55%” is the real Objective. The onboarding flow is one possible solution the team might discover.
The examples in this article follow Cagan’s principle from the product operating model : tell teams what you need them to achieve, how results will be measured, and let the team figure out the best way to solve the problem. That’s the difference between a feature factory and an empowered product organisation.
For more on structuring OKRs, see OKRs for Product Teams . For the distinction between OKRs and KPIs, see OKRs vs KPIs Explained . And for the organisational model that makes all of this work, see The Product Operating Model .
