Topic: OKRs

Objective Tagging, The Missing Connectivity between your backlog and The Board
A unifying guide on how roadmap tagging turns strategy into daily decisions, accelerates board alignment, and becomes effortless with RoadmapOne.

Key Result Tagging, The Science of Measuring What Matters
Transform how you measure success—Key Result tagging reveals whether you're measuring the right things, with the right confidence, using the right methods.
OKR Examples for Product Teams: 30+ Objectives and Key Results That Actually Work
Problems to Solve, Not Features to Build
30+ OKR examples for product teams—framed as business problems, not features. Includes bad-to-good rewrites, real-world examples from Google and Intel, examples tagged by Run/Grow/Transform, and how each Objective connects to squad allocation on your roadmap.

OKRs vs KPIs Explained: The Complete Guide for Product Teams
What You Watch vs What You Chase—And Why Most Teams Confuse the Two
KPIs are what you watch. OKRs are what you chase. KPIs tell finance what happened last quarter. OKRs tell product teams what to change next quarter. Here's the complete guide to the difference—with real examples, common mistakes, and how the two work together on your roadmap.

Ansoff Matrix: Strategic Tagging for Growth Risk, Not Prioritisation
Visualise Your Risk Profile, Then Use Real Frameworks to Prioritise
The Ansoff Matrix categorises growth strategies by risk profile—Market Penetration, Market Development, Product Development, Diversification. It's a tagging framework for visualising portfolio balance, not a prioritisation framework.

Elements of Value Pyramid: Interesting Theory, Limited Practice
An Academic Framework That Doesn't Survive Contact with Roadmaps
Bain's Elements of Value pyramid—30 types of value from functional to life-changing—is an interesting academic framework and training aid. It's not useful for actual roadmap prioritisation. Skip it for practical work; reference it for product thinking discussions.
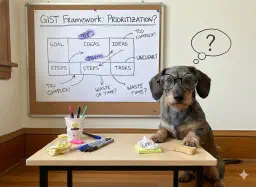
GIST Framework: You Probably Already Have This Under Different Names
Take the Confidence Meter, Skip the Extra Terminology
GIST (Goals, Ideas, Steps, Tasks) offers a layered planning framework from strategy to execution. Learn how it compares to OKRs, when the confidence meter concept is genuinely useful, and why you probably don't need the full framework.

HEART Framework: Tag Your Roadmap for User-Centred Balance
Happiness, Engagement, Adoption, Retention, Task Success—Are You Measuring All Five?
Google's HEART framework—Happiness, Engagement, Adoption, Retention, Task Success—provides user-centred metrics coverage. Use it as a tagging framework to ensure your roadmap is balanced across UX dimensions, not just shipping features.

Leading vs Lagging Indicators: Know If You're Winning Before It's Too Late
Predict Success with Leading Metrics, Confirm It with Lagging Ones
Leading indicators predict success; lagging indicators confirm it. Good OKRs pair lagging Objectives with leading Key Results—so you know whether you're on track before it's too late to course-correct.

North Star Metric: One Metric to Align Them All
Tag Your Roadmap to See What Percentage Actually Targets Core Value
Your North Star Metric is the single metric that captures core value delivery to customers. Tag Objectives in RoadmapOne to see what percentage of your roadmap directly targets your North Star—and whether the balance is right.

PULSE Framework: The Outdated Metrics Model Your Dashboard Might Still Follow
If Your Metrics Look Like This, You're Missing the User
PULSE (Page views, Uptime, Latency, Seven-day active users, Earnings) is the outdated metrics framework that HEART replaced. It's still useful as a diagnostic—if your dashboard looks like PULSE, you're missing user-centred measurement.

Technical Debt Classification: Internal Insight, Not Board Governance
When Categorising Debt Helps—and When It's Overhead
Technical debt classification helps Product & Engineering teams understand debt composition—but don't expect board engagement on categories. Tag debt-related Key Results by type (deliberate vs accidental, business-blocking vs aesthetic) when debt is a significant problem requiring structured remediation.

User Story Mapping: Tag Key Results by User Journey Stage
See Which Parts of the Customer Experience You're Actually Measuring
User Story Mapping isn't prioritisation—it's a tagging framework. The backbone represents user journey stages; tagging Key Results by backbone position shows which parts of the customer experience you're measuring. Use it alongside Pirate Metrics for complete journey visibility.

Pirate Metrics (AARRR): Dave McClure's Growth Funnel for Product Teams
Charting the Customer Voyage from First Click to Profit
Dave McClure's AARRR Pirate Metrics framework (Acquisition, Activation, Retention, Referral, Revenue) reveals where your funnel leaks. Includes an Uber Eats case study, key formulas for each stage, and how to tag your roadmap for board-level visibility.

OKRs for Product Teams: Why Most Implementations Fail (And How to Fix Yours)
The Implementation Guide That Doesn't Treat You Like a Beginner
76% of product teams attempt OKRs. Only 28% are satisfied with the results. Here's how to be in the 28%—with practical frameworks for objectives, key results, and roadmap connection.

Objective Tagging: Opex vs Capex
Help your finance team understand capital vs operational spend across your roadmap, enabling smarter budget allocation and tax planning.

How to Build a Product Roadmap That Actually Works
The Human Work Most Teams Skip
Most roadmaps fail not because of poor tools, but because teams skip the human work of building consensus. Here's how to create a roadmap stakeholders actually believe in—not just tolerate.

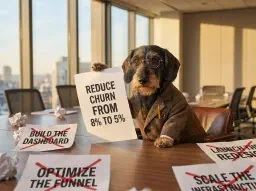
From Objectives to Key Results: How Product Managers Lead the Discovery Breakdown
Leadership allocates objectives. Empowered teams define key results. But how does that actually happen? Discovery is the collaborative workshop where product managers facilitate the breakdown from 'Increase retention 65% to 75%' to specific, validated, measurable key results teams commit to delivering. Master this moment—it's where PM leadership matters most.

Objective Tagging: Gartner's Run / Grow / Transform Model
Gartner's Run Grow Transform (RGT) model categorises roadmap work into three portfolio buckets. A pragmatic guide to the model, with real allocation examples, board-level analytics, and how to tag objectives in RoadmapOne.

Key Result Tagging: Committed vs Stretch Goals
The OKR Distinction That Separates Winners from Wishful Thinkers
Master the OKR fundamental that Google lives by—Committed goals demand 100% delivery, Stretch goals target 60-70% ambition—so boards and teams finally speak the same language about expectations.
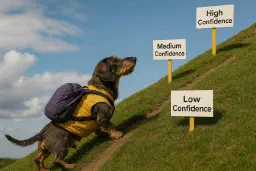
Key Result Tagging: Confidence Level %
From Static Predictions to Dynamic Risk Signals
Track evolving confidence (0-100%) in achieving each key result—not as a static guess but as a living signal for when to double down, pivot, or pull the plug before it's too late.

Key Result Tagging: Level of Ambition
From Moonshots to Certainties—Calibrating Stakeholder Expectations
Signal where teams stretch versus deliver with certainty—Low, Medium, High ambition, or High Integrity Commitments—so stakeholders calibrate expectations and debates shift from blame to learning.
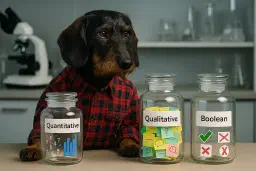
Key Result Tagging: Metric Type
When Numbers Tell Half the Story—Balancing Metrics with Meaning
Balance numbers with nuance—tag key results as Quantitative (metrics), Qualitative (insights), or Boolean (yes/no outcomes) to ensure you're not optimising spreadsheets while missing the stories that matter.

Key Result Tagging: Outcome vs Output vs Input
The Measurement Hierarchy That Separates Motion from Progress
Stop celebrating deliverables while impact stalls—tag key results as Outcomes (impact achieved), Outputs (deliverables produced), or Inputs (activities performed) to measure what actually moves the business.
Key Result Tagging: R&D Tax Credit
From Engineering Work to Tax Relief—Tagging What Qualifies
Turn qualifying R&D work into tax relief by tagging key results that prove technical uncertainty, systematic investigation, and genuine innovation—making claims audit-ready before HMRC comes knocking.

Key Result Tagging: Validation Method
Experiments vs Assumptions—The Difference Between Science and Wishful Thinking
Distinguish hypothesis-driven experiments from assumption-based guesses—tag how you're validating key results to expose which teams build on data and which gamble on intuition.
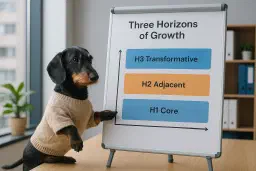
McKinsey's Three Horizons of Growth: H1, H2 & H3 Framework Explained
McKinsey's Three Horizons of Growth framework (H1, H2, H3) defines how to balance short-term core business, mid-term emerging opportunities, and long-term transformational bets. Tag your roadmap by horizon to ensure you're investing across all three time frames.
Objective Tagging: Core vs Context
Crossing the Chasm by stopping the Resource Drain on Work That Won't Win the Market
How Geoffrey Moore's Core-versus-Context distinction helps SaaS leaders protect differentiation, outsource the ordinary, and explain tough resourcing calls to the board.

Objective Tagging: Customer Journey Stage
From First Touch to Loyal Advocate—Mapping Roadmap Work to Lifecycle Stages
Map your roadmap to the customer lifecycle—Awareness, Consideration, Conversion, Retention—and ensure balanced investment across every stage from first touch to loyal advocate.

Objective Tagging: Jobs-to-be-Done
Why Customers Hire Your Product—and How to Tag Your Roadmap Accordingly
Stop building features and start hiring your product for jobs—Functional tasks, Emotional desires, and Social aspirations—that reveal why customers truly choose you.
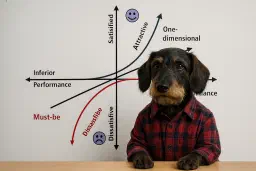
Objective Tagging: Kano Maps
Using Kano Maps to Build Love, Not Just Loyalty
Leveraging the Kano model—Must-Have, Performance, and Delighter attributes—to balance foundational reliability with wow moments on the product roadmap.

Objective Tagging: SAFe Enablers vs Business Features
Giving Platform Work the Story it Deserves
Demystifying SAFe's Enabler-type backlog items and showing product teams how explicit tagging sharpens conversations with technical architects and boards alike.
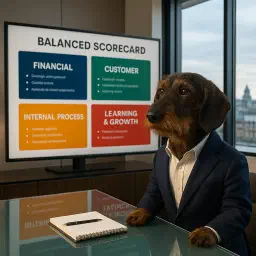
Objective Tagging: The Balanced Scorecard
Turning Strategy into Everyday Product Choices
Translating Kaplan & Norton's Balanced Scorecard into a roadmap-tagging lens that aligns product portfolios with strategy through Financial, Customer, Internal Process, and Learning & Growth perspectives.

Objective Tagging: The BCG Product Portfolio: Stars, Cows, Question Marks, Dogs
Letting the BCG Matrix Tell You When to Milk and When to Feed
Applying the classic BCG Growth-Share Matrix (Stars, Cash Cows, Question Marks, Dogs) to product portfolios and showing how roadmap tagging clarifies funding bets.
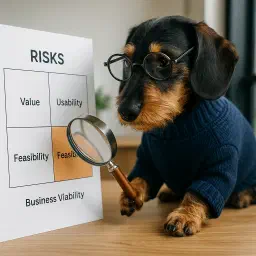
SVPG's Four Product Risks: Value, Usability, Feasibility & Viability (Marty Cagan)
Categorising Value, Usability, Feasibility, and Business Viability to de-risk the Roadmap
Marty Cagan's SVPG four product risks—Value, Usability, Feasibility, and Business Viability—give product teams a framework for de-risking every roadmap item. Tag objectives by risk type to focus discovery where it matters most.
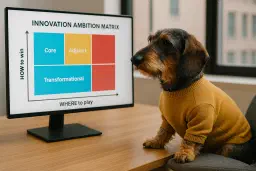
The Innovation Ambition Matrix: Core, Adjacent & Transformational (70-20-10)
Escaping the Core Comfort Zone
The Innovation Ambition Matrix (Nagji & Tuff, HBR 2012) splits your roadmap into Core (70%), Adjacent (20%), and Transformational (10%) initiatives. The twist? Returns follow the inverse ratio—70% of long-term returns come from Transformational. Here's how to tag, track, and rebalance your innovation portfolio.

Start with Why: Why We Are Building RoadmapOne
In 'Start with Why', Simon Sinek's proposes that great leaders and organizations inspire action by first explaining *why* they do what they do before explaining *what* they do or *how* they do it. So here's our Why...